This is the second part of a short series in which I'm investigating
alternate approaches to climate classification to the popular Koppen-Geiger
system. In
Part I, we investigated various existing classification systems proposed by
researchers in the past, either modifying the Koppen system or trying an
alternate approach. This time, I want to take some of the lessons learned in
that overview and apply them to constructing a new climate classification
system that serves our particular needs. We might call it the "Hersfeldt Bioclimate System" in keeping with climatology conventions, or "Pasta Bioclimate System" in keeping with this blog's conventions; whatever you prefer.
koppenpasta 2.0
Before we get to all that, a bit of bookkeeping: as mentioned last time, to
prepare for implementing a new climate classification system, I have
substantially overhauled
the koppenpasta script, reworking much of the internal functions to make it much easier to add
algorithms for new climate systems and options to tweak the outputs,
essentially converting it from a tool specifically designed around the
Koppen system to a more general climate classification tool.
From the user side, the functionality is much the same
but with a few tweaked options and extra toys:
-
Land zone options have been sorted into main types for the separate
systems described in Part I and subtypes with slightly different
approaches or subsets of zones.
-
Sea climate zones can now be selected separately, with its own subtypes
and color options.
-
A "seasonless" approach, feeding in averaged annual data to the
classification algorithm rather than monthly data, is now a separate
option that can be applied to any climate zone (though it may not work
all that sensibly for some of them).
-
There are now a few different options for how data from different files
is combined to produce a climate map:
-
"Average data" is the same procedure as old versions of the script:
basic climate data for each month (e.g. temperature, precipitation) is
averaged across all files first, and then important parameters (e.g.
hottest month, total precipitation) is calculated based on those
averages, treating them as if they came from one file.
-
"Average parameters" calculates parameters for each file separately,
and then averages those parameters together across files; this takes a
bit longer but might better reflect cases where, say, the hottest
month is at different points of the year in each file.
-
"Sequential" treats the files as separate portions of a single year,
lining them up in order of input (which should be alphabetical if
loaded from a folder); so you could have 4 files each representing
different quarters of a single year, and then use this option to treat
them properly as one long year.
-
Interpolation, including temperature adjustment by topography, is
properly implemented as an option for all climates, can now rescale to
any given resolution (computer memory allowing), and can use a couple
alternate routines where the usual spline method proves
unreliable.
I've also added an option for generating additional images beside the main
map:
First, the script can now automatically generate a map key showing the
appropriate color and name for all zones that appear on the map.
Second, it can also generate a chart of the average temperature and
precipitation of every point on the map, colored by the zone of that
point.
The most substantive change is that a lot of the more esoteric options for
things like varying climate zone definitions or internal routines have been
moved out of the default command line interface. Most people probably won't
need to alter these options at any point, but for those that do these can
now be set a few different ways:
-
Within the koppenpasta script itself, there's a clearly marked
"OPTIONS" section near the start of the script containing a list of all
the options with short explanations.
-
The download includes a separate configuration file,
"kpasta_options.cfg", which is not required to run the script but will
be used if present in the same folder, overriding the default options in
the script.
-
You can also copy this configuration file, modify it, and give it a
different name, and then during setup of koppenpasta there's an option
to select such a file, overriding both of the above.
-
During setup, there's also a final option that allows you to enter
option names and values directly through the command line, overriding
all of the above.
Note that the options lists in koppenpasta and kpasta_options.cfg also
contain the default values for the options set through the command-line
setup, like land type and color, so by altering these you can alter the
script's default behavior when you choose to skip setup. In general, options
are prioritized in the order of command-line input > custom config
file > kpasta_options.cfg > script defaults, with the former
overriding the latter. If you want to modify the script, additional options
can be added to the script or configuration file, and will then be available
to any functions within the script; incidentally you also don't have to
include every option in the configuration file, if it lacks any it will
default to the options in the script.
Most of these extra options are technicalities of zone definitions or
designed to deal with different data types other than ExoPlaSim
outputs—making it easier for me to continue doing public data explorations in the
future—but there's a few worth highlighting that you might not use often but on
occasion:
-
const_lapse_rate: when using temperature adjustment by topography, usually the program
tries to determine a regional "empirical" lapse rate (change of
temperature with elevation) based on variation between neighboring
cells, but this isn't always entirely reliable; if you set this value to
a number other than 0 or None, then that number will be used as a single global lapse rate (it
should be in units of °C decrease per km elevation, positive for decreasing temperature with
elevation; 5 °C/km is a typical value for Earth).
-
image_scale: This rescales the final image, without any interpolation involved.
You can either input a single scaling factor to multiply the size of the
image or a specific (x,y)
resolution (in that format, with a comma and parentheses). This might be
useful if you're producing uninterpolated images but want them at a more
readable resolution like (1024,512) rather than (128,64).
-
debug_file: Setting this to True
causes the script to save all data extracted from the input file,
parameters calculated from that file, and all option settings to a
netCDF file, which might help identify any issues within the
script.
-
temp_adjust, precip_adjust: These are the factors used to convert all temperature- and
precipitation-related measures in the input files to the standard
Celsius and mm/month scales used within the script. By default they're
set to the necessary conversions from ExoPlaSim's usual output scales
(Kelvin and m/s), but if you've used my eps_avg script to convert the
units in your data files, you may need to adjust these.
-
pet_gascon: this is the effective gas constant for use calculating potential
evapotranspiration with any climate system that needs it (e.g. Holdridge, Prentice, my new system). It depends on the average
molar mass of the atmosphere, so if you have a nitrogen-dominated
atmosphere similar to Earth (regardless of total atmospheric pressure,
only composition matters) you shouldn't need to change it from the
default of 287.05. If you have a substantially different atmospheric composition, you
may need to adjust it for accurate PET: usually in your ExoPlaSim
outputs there will be a file with "diag" in its name that can be read as
a text file, which should have a line near the front listing the
"GASCON".
There are a few others that may be worth tweaking related to my new
classification system, but I'll mention those later.
Custom color lists are also still supported, for all climate zones
including any you might add, and it's no longer necessary to include all
zones in each color list, only those you'll actually use; you can separately
decide if land and sea zones should reference the color list, but if both
are doing so they will use the same file.
Note that all this overrides the old config file system from previous
versions, and any files made with that system are no longer supported. Old
color lists should still work, as they're formatted the same way.
All the classification systems I showed generated maps for last time are
available as options. Some specific notes on some of them:
-
Koppen-Geiger climate zones work in much the same way, with the same
full, no-As, 14-zone reduced, and group-only variants as subtypes, and
also a new 2-letter option, categorizing zones by only the first 2
letters in the Koppen designation, as I've seen in some papers. For
colors, you have the same set of regular (blue rainforest), alternate
(red rainforest), and true color approximation as before. The various
configuration options once in the command line input have been moved to
the extended options, and I've added options to use the aridity
threshold calculation and Xs/Xw definitions from Trewartha.
-
For Koppen-Trewartha I've implemented a modest 2-letter, 14-zone
system, based on
Belda et al. 2014, but with group E split into Eo and Ec. Importing Am or the Xxa/Xxb
subtypes from Koppen-Geiger wouldn't be too difficult, I just haven't
wanted to bother coming up with enough colors; the default color scheme
is also taken from the paper, with some modification, but there's also a
"Koppen-alike" option copying the standard colors for the most similar
Koppen zones for each type. Many of the configuration options for
Koppen-Geiger are applied here as well.
-
Holdridge life zones are still here, but as mentioned I've properly
incorporated PETR now, though for simplicity's sake I'm approximating
the hexagonal grid with a staggered rectangular grid and prioritizing
average biotemperature over the other two factors. In addition to the
naturalistic green-yellow shades from wikipedia, there's also a more
vibrant color option taken from
Audebert et al. 2024. There is still an option to use the old scheme of indexing zones by
precipitation and biotemperature only, as well as a configuration option
to attempt to roughly predict average biotemperature if only average
temperature is available, as I've been doing for my
public data explorations, though don't regard that as a particularly reliable approach. So far
I haven't implemented a warm temperate/subtropical division, as I'd have
to decide how best to approximate the frost line with data available
from ExoPlaSim (and choose appropriate colors), but I might try that in
the future.
-
For Thornthwaite-Feddema I've implemented the primary 36-zone
classification by annual average PET and Pr/PET ratio and an alternate
12-zone classification by climate variability, with colors taken from
the paper.
-
The Prentice et al. 1992 BIOME1 model has been implemented, mapping
each vegetation type and then defining zones by their overlap.
-
Whittaker biomes, Woodward vegetation types, IPCC climate zones, and
the Sayre et al. World Climate Regions are all implemented, as described
in the last post.
-
Sea zones include the usual options for 4 zones, no separate tropical
zone, or one sea zone, and there's also options to assume no sea zones
at all, or color all seas white.
I've done my best to document the script and indicate how it should be
edited to alter the climate zone scheme or add a new one, but the more
flexible nature of how it operates has also made it a bit less linear.
There's a guide near the start on how data generally flows through the
script.
Goals and Reference Data
Now that we have the necessary tools, let's review some of our main goals
and challenges. For all the different approaches we reviewed in Part I, I
still want a system that fills the same sort of role as Koppen; it should
attempt to predict the distribution of biomes based on climate parameters.
Indeed, prediction of biomes is more specifically the goal here, taking
priority over any broader considerations of climate conditions, though those
will hopefully be clear along the way as well. But compared to Koppen, there
are three primary directions of improvement I want to make:
-
First, definitions should be based on the climate parameters with the
most direct functional link to biome boundaries, rather than indirect
proxies.
-
Second, definitions should be adjusted and expanded to better
accommodate a broader range of worlds with different temperature ranges
and seasonal planets, at least to the range that could conceivably
support Earthlike life.
-
Third, potential differences in biology should be accounted for to some
extent, at least in the sense that boundaries should reflect ecological
reactions to fundamental environmental barriers that we might reasonably
expect to appear on alien worlds, rather than the particular
evolutionary quirks of modern Earth.
Most suggestions I see for modifying the Koppen system are focused on that
second goal, essentially just tacking on extra categories to cover greater
extremes of summer heat or overall seasonality (by the way, if you do
something like that I'd suggest not using "x" as the letter designation for
any of these additional categories because it's common practice to use "x"
as a stand-in for any unspecified letter; e.g. I can say "Xxa" to refer to
all zones ending in "a", meaning Cwa, Cfa, Csa, Dwa, Dfa, and Dsa). But,
with a mind to that first goal, I want to make some more fundamental changes
here, essentially borrowing some of the methodology of the Woodward and
Prentice et al. models while still trying to retain some of the flexibility
and greater detail of the Koppen system.
I also want any such extension into exotic climate to have some similar
connection to ecology and biomes, rather than picking arbitrary temperature
thresholds. Because we have no ecology to observe from such environments,
this may be quite difficult to achieve, but there is some research to go on
that at least suggests some potential challenges and ecological
barriers that life may encounter.
Similarly, the third goal requires making a fair few assumptions about the
nature of life on other worlds, even if we explicitly limit the scope of
this system to life with broadly similar biochemistry to Earth. Ultimately,
though, the less assumptions we make regarding common ecological barriers
across worlds, the less we can say about their ecology at all, so in many
cases we're faced with a choice between making highly contingent biome
predictions or making no predictions at all. This is essentially the same
quandary that many climate classification systems face just predicting
biomes on Earth: there are confounding factors outside of climate, so these
predictions must always have some inaccuracy, but if we're determined to
attempt some prediction then we just have to accept that inevitability.
Suffice it to say that I will generally tend to make assumptions here where
they are required to allow for specific predictions, but there are a few
cases where biome boundaries on Earth are clearly linked to the specific
context of our current planet rather than fundamental ecological
mechanisms.
Now, if we want this system to correspond to real biomes and we'll be
judging it largely on its success doing so, we need some reliable data on
where those are on earth. I've picked out 5 primary sources to draw
on:
-
The
WWF Terrestrial Ecoregions, based on an influential
2001 study
by Olson et al. which classifies land areas into biogeographic
ecoregions that are in turn sorted into biomes and biogeographic realms.
It uses 15 biomes, and 4 of these are at least partially based on
terrain or elevation factors that couldn't be identified from climate
data, so it's a fairly coarse categorization but still a good place to
start, and the ecoregions give some sense of finer biome boundaries.

|
This original version has been a tad adjusted now and excludes the
"Rock and Ice" category from the key.Olson et al 2001
|
-
The
IUCN Global Ecosystem Typology, which classifies land areas into 7 broad biomes, subdivided into 34
functional groups with distinct ecology. 1 of these biomes is areas of
intensive land use by humans and a few of the functional groups are
defined mostly by terrain features (as are the various
terrestrial/marine/freshwater transitional biomes also included in the
typology), but that still leaves us with around 25 ecosystem types to
work from, including some not always mentioned in biome categorizations
like heathlands and dry woodlands. However, these biomes and functional
groups are not defined as exclusive areas, but mapped out as often
overlapping regions where they're more or somewhat less likely to occur,
acknowledging that many areas have a patchwork of different ecosystems,
so though it helps suggest some potential ways to add more detail, it's
not as useful for the exact placement of important boundaries.
-
Haxeltine and Prentice's
1996 paper
describing BIOME3, one of the followups to Prentice et al.'s 1992 model,
includes a fairly detailed map with 18 biomes based on a variety of
sources, constructed for gauging the success of their model but useful
for us as well, with particularly good detail on semiarid regions often
left a bit neglected in biome breakdowns.
-
The book
Habitats of the World: A Field Guide for Birders, Naturalists, and
Ecologists, by Iain Campbell et al. It somewhat follows the Olson et al. 2001
study in broadly categorizing biomes, but then breaks them down into
biogeographic regions somewhat larger than the WWF ecoregions, and so
more directly corresponding to distinct biomes, though it's similar to
the IUCN approach in that it doesn't mark these regions as wholly
exclusive with each other. Because it's written as a travel guide, it
specifically focuses on areas with a different feel or appearance, and
so highlights some areas like taiga savanna or miombo woodland that
aren't always identified in more rigorous studies.
-
This 2014 map by Pfandenhauer and Klötzli, , produced for the
German textbook
Vegetation der Erde, based on several previous sources; I've attempted an English
translation of the key here, helped along by a version of this map
in
Fischer et al. 2022. It's detailed, including 32 exclusively marked biomes (plus wetlands as
essentially a modifier), and also hits an interesting balance between mapping global biomes
based on shared functional plant types, while also sometimes
highlighting biomes that are more unique to particular regions and so
may reflect local evolutionary quirks, which helps in gauging how to
interpret similar biomes across continents.
The amount of variation that exists between these systems goes to show how
subjective these classification systems can be, and all show a world
substantially influenced by human activity. They all make some attempt to
reconstruct the "natural" state that areas would have if they weren't
covered by cropland, pasture, or other development, but thousands of years
of agriculture, herding, lumber use, and fire setting have substantially
shifted biome boundaries in some areas in a way that can be difficult to
reconstruct, not to mention more recent climate change. So even aside from
any other confounding factors, we'll have to accept some problem
areas.
That all settled, it's time to put the system together. I won't go through
every iteration and detour of the process, but I do want to lay out the main
logic and motivations behind the resulting system on a conceptual level,
after which I'll list out a bit more rigorously the required climate data
and resulting bioclimate zone definitions.
Constructing the Pasta Bioclimate System
Let's start with the broadest biome concepts. When unhindered by major
environmental barriers, life on land tends towards the end state of a
forest, filling the space to the limit of available photosynthetic area
(ecologists might call this a climax community, but we'll leave that
sort of discussion to another time). However, various areas of the planet do
have environmental restrictions, in some cases to the opposite end state of
preventing the growth of vegetation entirely. Leaving aside areas with poor
terrain stability or soil quality (neither of which cover much area), on
Earth such areas occur where it is either too dry for growth or too cold,
but we can easily envision other habitable worlds with substantial areas too
hot or too dark as well. Between forests and these barren extremes are a
number of transitional biomes, but exactly how those biomes look depends on
the opposing end states. We'll start with forests, then, and then work
outwards to the biomes that emerge as additional restrictions are
added.
Tropical and Cold Forests
Life on Earth generally seems to be happiest at temperatures around 20-30 °C, forming tropical rainforests that are the most biodiverse and productive
(in terms of rates of carbon fixation) regions on modern Earth. Outside of
this range, growth rates decline, but even tropical plants can weather
occasional growth interruptions: the real issue is that low temperatures can
damage vegetation, so the extent of tropical biomes is mostly bounded by
thermal tolerance limits.
Based on our previous sources and other work, here's a range of potential
tolerance limits for minimum temperature encountered for more than a
brief period in a typical year, for a range of life forms—do note that some of these are very approximate:
-
18 °C: tolerance limit for shallow marine coral.
-
10 °C: tolerance limit for some particularly warm-adapted tropical
plants.
-
0 °C: the frost point, when ice formation may damage exposed soft
tissues; tolerance limit for tropical plants; minimum growth temperature
for even cold-adapted plants.
-
-15 °C: tolerance limit for frost-tolerant broad-leaved evergreens
-
-20 °C:
minimum growth temperature
for extremophile photosynthetic microbes.
-
-40 °C: tolerance limit for many non-boreal plants.
-
-60 °C: tolerance limit for needle-leaved evergreens; approximate freezing
point of water-H2O2 mix.
-
-80 °C: minimum temperature with
observed metabolic activity; potential atmospheric freezeout in CO2-rich atmospheres.
-
-97 °C: freezing point of water-ammonia mix.
-
-180 °C: atmospheric freezeout in N2/O2-rich atmospheres;
freezing point of
Li-ammonia brines.
Of these, the 0, -15, and -60 °C
limits generally seem to be the most important in dividing forest types, at
least on Earth, with the first generally marking the limits of the tropical
zone. So to start off with, we'll divide the bioclimate system into two
first categories:
-
Tropical (group T), which retain clement temperatures
year-round.
-
Cold (group C), which have periods of winter frost.

|
|
I'll explain the exact thresholds using for dividing zones later
|
The other tolerance limits do have some relevance within group C, but
the most notable shifts in forest composition relate more to the overall
seasonal cycle and length of the growing season. Forests on Earth
show a curious back-and-forth pattern
of evergreen trees, which retain their leaves
year-round, dominating in the tropics and subtropics (we might also call
them evergrowth if we don't want to make any assumptions
about the dominant color); deciduous trees, which drop their
leaves in fall and regrow them in spring, dominating in the
mid-latitudes; and then back to evergreen trees in cold polar forests
(and then one final reversion to deciduous conifers in the most seasonal
parts of Siberia, but this is likely due to cold tolerances we'll get back
to shortly).
There's a number of factors that play into this pattern, but for our
purposes the simple version is that each transition reflects how different
parts of the seasonal cycle impose different stresses on a tree and so
favor different optimal growing strategies. Each leaf can be understood as
a sort of economic investment on the part of the tree: there is an upfront
"cost" in terms of energy and nutrients required to grow the leaf, and
then during each leaf's lifetime it generates "income" in terms of energy
from photosynthesis but still has ongoing maintenance "expenses" to repair
damage and replace water losses due to evapotranspiration through the
leaves. For a tree with limited energy resources and space, the objective
is to maximize the rate of total "profit", in terms of income minus
expenses relative to the lifetime of the leaf, in order to maximize growth
and so outcompete its neighbors.
Within the warm tropics, consistent high temperatures (and moisture within
heavily forested areas) provide good growing conditions year-round means
that leaves can always produce more income than expenses. As a leaf ages,
it may begin to degrade (and there is some stochastic chance of damage due
to herbivory, fires, etc.) but each leaf can just be individually replaced
at the optimal point to maximize profit.
In colder climates, there will be a winter period where photosynthesis
slows, but maintenance must still be maintained, so income may fall below
expenses and leaves cause an overall energy loss (frozen ground also
yields less water, so evapotranspiration losses through leaves may
dangerously deplete the plant's water). In subtropical climates, winters
are still short and mild enough that the cost of maintaining leaves
through this unproductive period is still small relative to the cost of
growing whole new leaves in spring (there's also an added opportunity cost
to losing and regrowing leaves, because the tree misses out on some
potential photosynthesis in late fall after losing leaves and early spring
before growing new ones), so trees still mostly retain their leaves
year-round, though they may need to make some adaptational compromises to
tolerate the occasional frost.
But in even colder climates, that winter maintenance cost mounts. The tree
can adapt to reduce those expenses by having thinner leaves with thicker
protective coatings to reduce frost damage and evapotranspiration losses,
but these leaves will also be less productive in summer. In areas with
mild winter temperatures or poor summer growing conditions (generally
because of limited water or heavy cloud cover), this tradeoff may be worth
it, but in most temperate climates on Earth the optimal strategy is to
become deciduous, dropping all leaves in fall and growing new leaves in
spring. The cost of growing new leaves is still generally higher than that
of retaining old leaves, but because these leaves don't have to survive
any frosts or last for more than a year, they can be optimized for maximum
productivity in their short summer lifetimes, returning a greater overall
profit.
Thus, evergreen subtropical forests dominate where winters are short
and the cost of retaining leaves is quite low, but once winters become
long and cold enough to significantly interrupt growth, they generally
give way to deciduous temperate forests (though some temperate areas
instead have hardier evergreens).
But as we go on to colder climates, even longer winters don't much
increase the maintenance expenses for retaining leaves; as temperatures
drop below freezing, plants can go largely dormant and minimize losses
to metabolic activity or evapotranspiration, especially hardy
frost-adapted evergreens (i.e. conifers). The more important change is
that the growing season shortens, such that deciduous leaves have an
increasingly short period to recoup the cost of their growth before
winter returns. Even if optimized for maximum production in that short
summer, eventually the production over the course of each summer barely
covers the cost of growing new leaves each year. Evergreens may produce
less each year but accumulate a higher net profit over successive years
thanks to lower average costs (and again can take better advantage of
early spring and late fall, which are a larger portion of the total
potential growing period). Thus, temperate deciduous forests transition
to evergreen boreal forests.
The overall upshot here is that the subtropical-temperate transition
is mostly related to the length of unproductive winter,
regardless of the exact length of the growing season, and the
temperate-boreal transition is mostly related to the length of the
productive summer, regardless of the length of unproductive
winter.
Thus, the group C is primarily split into 3 main
subgroups:
-
Subtropical (CT), with short winter interruptions to growth.
-
Temperate (CD), with a long winter interruption but still
a long growing season.
-
Boreal (CE), with a short growing season.
It is worth emphasizing again that we shouldn't get too attached to
thinking of these subgroups purely in terms of evergrowth and
deciduous trees. As mentioned, there are some more
evergreen-dominated CD areas that are
still clearly distinct from their subtropical and boreal
counterparts, lacking the broad leaves of the former but with
faster growth and lusher undergrowth than the latter.
On Earth, these tend to be associated with especially heavy rains
(temperate rainforests) or conversely summer droughts
(Mediterranean), but the exact balance of necessary conditions is
tricky to pin down with simple climate parameters and
could conceivably vary considerably with different year lengths
and seasonal cycles. Even in more deciduous-dominated areas, CD
forests tend to have some
evergreen trees taking advantage of their exclusive access to
early spring and late fall light or their better performance in
poor soils due to their lower nutrient requirements, and for their part CT forests may shade to semideciduous in drier
areas while CE regions may have some deciduous trees where winters
are particularly harsh.
To avoid overtuning this system to Earth, then, it's perhaps better
to think of these zones not strictly in terms of evergrowth and
deciduous habits, but more broadly of CT as regions warm enough
year-round to support tropical-like vegetation, despite the
inconvenience of frosts; CE as regions with only intermittent short
periods of growth that can support only the most conservative growth
patterns; and CD as a range of intermediate climates that have
substantial periods of growth but fall short of the heat or
consistency required for thick tropical vegetation. In this looser
sense, these ecological boundaries are also more likely to have some
relevance to alien biospheres with different photosynthetic
structures.
Past the boreal forests, eventually the growing season gets too
short to cover even the hardiest evergrowth's costs, though we can
subdivide the polar regions a bit based on their suitability for at
least some low shrubs:
-
Tundra (CF), with a very short but still significant
growing season.
-
Cold Barren (CG), with no substantial growing
season but no permanent ice cover.
-
Ice Sheet (CI), with permanent ice cover.
The tricky bit is how well these patterns will apply to other worlds
with different seasonal patterns:
If a world has shorter years but a similar range of seasonal
temperature variation, both summers and winters will shorten, which
should tend to shrink CD zones until CT transitions directly to CE; in
such cases I'll divide them based on winter growth interruption, on
the presumption that so long as winters are brief and mild,
subtropical plants should be able to simply continue to grow across
years with little issue; but once winters are severe enough to
substantially interrupt growth, the short growth periods between
winters becomes a more serious issue. Extremely short years could
perhaps eliminate even CE zones, but again we'll take CT and CF zones
to be divided based on growth interruption on the same logic.
Very long years conversely favor CD climates, though always with some
transition to CT and CE climates so long as there are still tropical
and polar regions. In subtropical climates, long summers aren't likely
to change the equation much in terms of when winter growth
interruptions are long enough to force a switch to deciduous or
hardier evergrowth leaves. In boreal climates,
however, even if maintenance costs remain very low for the bulk of
winter, a substantially longer winter may cause more degradation of
leaves between growing seasons, increasing the relative benefit of
growing new leaves. However, I have no real way to predict at what
exact effect this might have without making several assumptions about
the nature of the vegetation involved, so I'll make no attempt to
account for it here. Extremely long years might also allow for
larger plants to complete their entire lifecycle in a single year
before dying in fall, opening up more potential niches, but again
there's not much basis to speculate on exactly how that might
influence biome transitions.
Worlds with very low seasonality present a bit more of a challenge,
as they create climates with year-round mild temperatures, which we
don't see too often on Earth. I'll discuss the specific numbers later,
but on Earth there seems to be significant overlap between the range
of temperatures cold enough to interrupt growth in subtropical
climates but warm enough to support growth in temperate climates, so
the most straightforward extrapolation is to classify these
consistently mild climates as CD, but rather than deciduous plants
we'd expect them to be dominated by evergrowths similar to temperate
rainforest or Mediterranean regions. Exactly how seasonal a world
would have to be for deciduous plants to appear is difficult to
determine from Earth data alone, and might depend on the specifics of
local evolution anyway.
At any rate, for further subdividing cold C climates we can now return
to minimum temperature tolerances: around -15 °C
is cold enough to damage plants without more substantial adaptations to
frost tolerance, causing a subtle shift in forest tree and undergrowth
composition, and -60 °C
is cold enough that even the most frost-tolerant plants cannot prevent
ice formation in their exposed soft tissues, forcing a final switch from
evergrowth back to deciduous plants. We can thus subdivide our groups
based on winter temperatures:
-
Oceanic (Cxa) zones have cool winters that don't require
intensive frost tolerance.
-
Continental (Cxb) zones have cold winters requiring
greater frost tolerance.
-
Percontinental (Cxc) zones have frigid winters too harsh
for even frost-tolerant evergrowths.
But to keep down the total zone count, we'll trim this system in a
few places:
-
Subtropical (CT) zones will be restricted to cool winters, on the
presumption that even a short but cold winter will damage
subtropical evergrowths and so force a switch to deciduous (or more
frost-tolerant evergrowth) plants.
-
The percontinental category will only be applied to boreal (CE)
zones, as the frigid winter threshold should only be relevant to
frost-tolerant evergrowths.
-
Tundra (CF) will be divided into cool and cold variants, to divide
milder coastal and highland tundra that might support more shrubs
and grasses from harsher continental tundra, but CG and CI zones
have too little life for minimum temperature to matter much and are
unlikely to have cool winters at any rate.
Arid and Semiarid Climates
Earth's other main gradient from lush forests to lifeless deserts is, of
course, linked to water availability. Photosynthetic production is limited
by soil water availability both because water is directly consumed in photosynthesis and because
there's no practical way for a plant to allow CO2
to passively diffuse into its photosynthetic structures without also
allowing some water to diffuse out (both CAM and C4
photosynthesis limit this water loss in different ways, but impose their
own productivity costs—we'll discuss them both more another time). Plants in dry conditions must
then maintain a tricky balance between growing as much as they can to
outcompete their rivals while never exhausting their water supply
completely, which would cause them to desiccate and sustain damage or
die.
Some plants may respond to long droughts by becoming deciduous, just as
temperate plants respond to winter, but others may instead respond by
developing hardier leaves or reducing their leaf area (through which water
is lost) relative to their root area (through which water is gained). This
creates a somewhat complex tangle of semideciduous forests, where a
short dry season prompts some trees to become deciduous while others can
remain evergreen, or some may be optionally deciduous depending on drought
severity in a given year; dry forests, where more severe droughts
prompt all plants to become regularly deciduous; savannas, where
trees are present but with an open-enough canopy to allow light for
substantial grass to grow between them; and more exclusive
grassland or shrubs, though this is fairly rare in tropical
climates (note that grasses are a specific phylogenetic group on Earth that rose
to prominence fairly recently, but for convenience I'll be using the term
to refer broadly to low-growing vegetation that grows in the open and has
little or no permanent above-ground structure, which is likely to be a
common niche). Then within savanna there's also a lot of variation along
fairly continuous spectra, both from moist to dry varieties
with increasingly severe droughts requiring more substantial adaptations
for drought tolerance, and from more open savannas with only
scattered or very low trees to woodlands where trees are as densely
packed as forests but with individually small or thin canopies such that
enough light still reaches the ground to support grasses (and there's
variation as well in terms of dominance of grasses or low shrubs between
the tall trees).
There are some parallels here with cold climates, because drought and
winter pose some similar challenges—frozen ground yields little water to trees in winter—but there's no direct analogue to boreal forests in dry climates;
evergrowth trees can become more common in cooler semiarid climates, and
in very dry climates cacti and other succulents might be considered a form
of evergrowth, but there is no range of drought conditions that
specifically favors dense forests of evergrowth trees, likely because hot,
dry conditions impose a much higher maintenance cost for retaining leaves,
reducing the potential benefit compared to losing them and growing new
ones when rain returns.
Many classification systems, especially Koppen, make little effort to
distinguish many of these categories, and generally have trouble dividing
grasslands and savanna from forests in cooler climates as well. This may
be due to a couple reasons: First, definitions of these biomes can vary considerably, in particular
with regards to which woodlands and temperate grasslands can be counted as
savanna, and really these may be quite gradual transitions in many cases.
Second, the distribution of these biomes may be strongly influenced by
factors outside of climate, like soil quality.
Frequent fires or
grazing by large herbivores in particular may limit tree growth, forming
savannas where forests might grow otherwise, and these factors have some
relation to climate but are harder to predict than simple thresholds of
water availability or growing temperature.
For my part, I could not find any measure to consistently divide open
savanna and grassland, woodland, and dry forest, but I did at least
attempt a somewhat finer breakdown of semiarid regions based on the
aridity factor, here defined as the
ratio of actual evapotranspiration to potential transpiration, as
used in the Prentice et al. model. Where the factor is high, a small drop
indicates some period of dry conditions which in tropical climates will
require some adaptation regardless of exactly when it occurs; and where
the factor is low, a small rise shows some period of rain, which will
support some marginal plant life, again regardless of exactly when it
occurs. At intermediate levels, however, the best match to biome
boundaries comes from measuring the aridity factor specifically during the
growing season, as the capacity for a semiarid region to support thick
woodland or lush shrubs depends more strongly on whether water is
immediately available during the optimal growth period.
We'll start with tropical zones, which have the most clear gradations
between wet and dry conditions:
-
Tropical Rainforest (Tr) has a very high aridity factor,
allowing for thick evergrowth.
-
Tropical Forest (Tf) has a lower but still high aridity
factor, shifting towards a more semideciduous composition.
-
Tropical Moist Savanna (Ts) has a moderate overall aridity
factor but still somewhat high in the growing season, allowing for
lusher woodlands and savanna.
-
Tropical Dry Savanna (TA) has a low growing season aridity
factor, favoring more open savanna or deciduous dry forests.
Even drier climates cannot support much in the way of trees or lush
undergrowth, and so share little life with wet tropical zones; we'll thus
split off our third top-level group:
-
Arid (group A), with a low aridity factor too low for
forests.
Many desert regions do actually support a fair amount of grasses and
shrubs, so we can subdivide this group a bit as well:
-
Semidesert (Ad) has a moderately low aridity factor still
allowing for widespread vegetation.
-
Hyperarid Desert (Ah) has a very low aridity factor, with
little vegetation.
This overall scheme can then be generally carried across into colder
climates, but with decreasing variety as there are fewer viable strategies
to tolerate both harsh winters and drought, such that diverse savanna and
woodland transitions to more uniform grassland and steppe.
-
Subtropical (CT) zones lack a distinct rainforest category, but still
partially parallel tropical zones:
-
Subtropical Forest (CTf) has a high aridity factor and so
thick evergrowth forests.
-
Subtropical Moist Savanna (CTs) has a lower aridity factor
and so tends towards less lush semideciduous forest or
woodland.
-
All C zones warmer than tundra will remain as forests so long as the
aridity in the growing season is high, but then transition into
semiarid zones depending on temperature:
-
Cool Semiarid (CA) has a low growing season aridity
factor.
The distinction between hot and cold arid zones in many systems seems to
relate mostly to the transition between C3 and C4 grasses; C4 plants use CO2
more efficiently, and many plants lose water mostly in the process of
gaining CO2, so they're at an advantage in hot, dry environments with high
evapotranspiration. However, the temperature at which C4
plants gain that advantage depends strongly on the atmospheric CO2 level, and in general C4
photosynthesis evolved fairly recently on Earth, so there's little
guarantee that this distinction will consistently apply across planets.
However, the cool/cold winter temperature line does seem to roughly
correspond to the transition from savannas and dry forests parallelling
tropical climates to more typically treeless grasslands in cooler
climates:
-
Cool Dry Savanna (CAa) has cool winters.
-
Cool Steppe (CAb) has cold or frigid winters.
The tropical/cold distinction doesn't have much impact on deserts, but
again cold winters do have some more impact on vegetation and wildlife and
generally seem like a good way to divide up what will be very large
zones.
-
Warm Arid (Axa), with cool or warm winters.
-
Cold Arid (Axc), with cold or frigid winters.
As we approach the coldest climates, the aridity factor becomes generally
less important as growing seasons become too short for some plants,
evapotranspiration remains low, and frozen ground and cold air in winter
yields little water regardless; so we'll give some precedence to cold
zones over arid zones:
-
Tundra (CF) will take precedence over semiarid (CA), so CA terminates
where the growing season is too short for trees or large grasses
regardless of aridity.
-
Cold Barren (CG) will take precedence over Arid (A), so A terminates
where the growing season is too short for almost any vegetation
regardless of aridity.
Mediterranean and Pluvial Climates
The final element to consider for Earthlike land climates is a finer
breakdown based on seasonal precipitation patterns. The Koppen system of
course has its dry-summer Xs and wet-summer Xw zones, but these are
defined by seasonal extreme months in a scheme that makes them somewhat
awkward to apply for worlds with a different number or length of months or
substantially different seasonal patterns. The overlap of these zones with
Koppen's various thermal categories also adds 14 zones to the scheme,
accounting for almost half of the total despite covering less than 11% of
Earth's land area altogether; that in itself isn't necessarily a problem
given that Earth is also a bit skewed in the relative area of different
biomes, but many of these Koppen zones don't have a clear connection to
Earth's actual biomes.
We'll start out with Mediterranean or chapparal climates, which have the
peculiarity of having relatively dry summers and wet winters. The reverse
is usually the norm, because evapotranspiration is higher in summer and
moisture-laden winds tend to converge on warm landmasses, but
Mediterranean climates appear in areas awkwardly caught between
circulation cells or where shifting winds around mountains create seasonal
rainshadows. These areas should also ideally be somewhat semiarid, neither
too wet—such that summer rains are still sufficient for regular forest growth
despite being relatively drier than winter—or too dry—such that there's insufficient water for much vegetation at all. This
particular combination of conditions creates biomes where there is
sufficient moisture for substantial vegetation but it doesn't coincide
with optimal temperatures for growth, so plants have to rely on stored
water, groundwater, or flowing water; or adapt to take advantage of
sporadic growing conditions rather than a single concentrated growing
season. This fosters a diverse evergrowth/deciduous mix, and often causes
a "mosaic" landscape, with groundwater-dependent vegetation clustering
along streams and in wet soil, while ridgelines remain more bare.
Koppen's Xs category actually does a fairly decent job of identifying
these areas, but again is too reliant on a specific sampling scheme and
assumed seasonal cycle. Trying to find an alternative, more flexible
measure was difficult, but after testing dozens of potential parameters,
the most reliable indicator I've found for Mediterranean biomes is what
I'll call the growth supply factor, which compares precipitation in
the growing season to total evaporation for the year. This essentially
represents how much of the total water available for photosynthesis comes
from rains that actually occur during the growing season; a low growth
supply factor indicates that while a region has a significant source of
water, it doesn't coincide well with growth and so plants have to rely
largely on soil or stored water.
Thus, we'll break off Mediterranean zones as a separate group in the C
class, as the wet winter/dry summer pattern seems to largely obfuscate the
relative advantages of deciduous and evergrowth plants and instead favor a
fine mosaic based on how local soil and topography affects water
availability. Unlike the other zones, we'll also extend this group into semiarid zones,
and in fact this accounts for most of Earth's Mediterranean biomes; moist
submediterranean zones are relatively rare but a few notable patches make
them worth including.
-
Submediterranean (CM), with a low growth supply factor
but high growing season aridity factor, indicating a summer drought
but still enough summer rain for thick vegetation.
-
Mediterranean (CAM), with a low growth supply factor and low
growing season aridity factor, indicating a more substantial summer
drought.
These zones will take priority over CT, CD, CE, and CA, but still give
way to CF and A.
On the other hand, Koppen's dry-winter zones don't have as clear a
utility; though they do give some sense of the extent of the East Asian
monsoon, they don't actually seem to consistently correspond to any
particular biomes: especially in the cooler areas, these ares are
distinguished mostly by their dry winters rather than wet summers, but
vegetation will be mostly dormant in winter and not get much water out of
frozen soil anyway, so a dry winter isn't a particular hazard and the
vegetation in these areas ends up not much different from their European
and North American counterparts, many of which actually have moderately
drier summers than winters.
Instead, I've found more utility from the evaporation ratio,
comparing total evapotranspiration to total precipitation, essentially
representing the portion of precipitated water that remains in the soil
and evaporates in the same place; if the ratio is below 1, that shortfall
indicates runoff in periods where the soil was already saturated with
water, so a low ratio indicates at least part of the year where rains far
exceeding potential evapotranspiration and cause soil saturation and
significant runoff.
Thus for most of the zones I'm marking out a parallel set of pluvial
zones:
-
Pluvial (Xxp) has a low evaporation ratio, indicating periods
of excessive rain.
This adds quite a bit of extra zones given how little area they end up
collectively covering, but this neatly accounts for a range of notable
biomes and climate types:
-
For rainforest (Tr), a pluvial zone may seem redundant, but it
indicates where rainfall is so heavy that soil nutrient leaching may
become a serious issue, causing some patches of forest to give way to
shrubby heathland (though exactly where this happens depends strongly
on local soil geology and topography, so it's more an indication of
regions at risk of soil depletion than a direct match to such
areas).
-
For other tropical and subtropical regions, it indicates particularly
heavy monsoon rains, which may support denser forests than the
categorization by aridity factor alone suggests.
-
For temperate and boreal regions, it indicates temperate rainforests,
which tend to be particularly lush and also somewhat more favorable to
evergrowth/deciduous mixes.
Semiarid pluvial zones are quite rare on Earth, but worth including in
case they help show very strong monsoons on other worlds. Just to keep the
count of zones down a bit, though, I have excluded pluvial subtypes
from:
-
Arid (A) zones, which we expect to get rain mostly in sporadic storms
anyway.
-
Tundra (CF) zones and colder, where low evaporation, frozen soil, and
significant ice melt make the evaporation ratio a poor indicator of
wet conditions.
-
Mediterranean (CM) zones, where the severity of the heaviest rains in
winter doesn't particularly shift the overall nature of the climate
and vegetation.
Perhaps I'm repeating the sins of Koppen by adding so many extra zones to
account for one additional factor, but they seem to have more relevance to
biomes and we can largely think of pluvial conditions as a modifier on other
zones, with a simple color scheme to reflect this.
That about covers the range of land climates we expect to encounter on
Earth, with a total of 38 zones (25 excluding the pluvial zones), which fits
fairly well with more detailed counts of Earth's biomes. However, the
challenge now is to try to extend this out to account for climates well
outside Earth's norm, extrapolating as best we can from the ecological
principles and tolerances we've established for life here.
Quasitropical and Dark Climates
To start out with, there's a few quick modifications we can make to
account for climates that might have a similar range of temperatures as
Earth but a different pattern of seasons or light coverage. On a
tidal-locked planet or other world with weak seasons, for example,
substantial areas might never have winters colder than the tolerance
limits for tropical plants but still have generally milder temperatures
than regularly experienced in Earth's tropics and so slower growth. There
could also be worlds with warm poles or nightsides that maintain tropical
temperatures but simply lack the light for photosynthesis and growth for
part of the year.
To cover both of these cases, tropical climates will be split into two
main subgroups:
-
Eutropical (TU), with good growing conditions
year-round.
-
Quasitropical (TQ), with a period of growth interruption
similar to temperate climates.
We could perhaps imagine various special cases with different patterns of
seasonal light cover or temperature variation overlapping with different
precipitation patterns, but I'll keep things simple here. Most of the
moisture gradations will by mirrored across both groups, save that I'll
exclude rainforests from quasitropical zones on the presumption that
growth interruption from limited light or moderate temperatures affects
forest dynamics in a similar way to the mild winters of subtropical
zones. Low light may inhibit growth, but will also reduce evapotranspiration,
so there's less need for a deciduous habit to limit maintenance costs so
long as temperatures remain mild.
Areas with very little light will then transition to more marginal zones,
in line with cold regions:
-
Tropical Twilight (TF), with too little light for large
vegetation.
-
Tropical Dark (TG), with too little light for almost any
vegetation.
Much as in cold climates, TF will take priority over semiarid climates and
TG over arid climates, as we expect them to have little vegetation
regardless, and in low light evapotranspiration and aridity will be less of
a concern anyway.
Hot Climates
Handling hotter and extremely seasonal climates may be trickier. Tolerance
limits for maximum temperature are not often considered in climate
classifications because few areas on Earth seem to hit any such limits,
aside from perhaps some deserts where water availability is the overriding
concern anyway. Some tundra plants may respond poorly to tropical
temperatures, but we'd expect them to be displaced by other plant types long
before temperatures rose that high anyway. The hottest sustained climates on
Earth since the evolution of land plants have been about 10-15 °C
hotter than today, but this relative warming was mostly concentrated towards
the poles; temperatures
may have spiked higher
for brief periods during the End-Permian mass extinction, and there is some
indication of widespread vegetation die-offs, but this could reflect
shifting precipitation patterns, ecological shock from rapid climate change,
or any number of other potential stressors at that time, and even if it was
primarily temperature-driven this doesn't necessarily reflect the capacity
of life to adapt to a sustained warm climate. Stable Earthlike worlds might
be able to reach averages of over 40 or even 60 °C, and as we've seen even worlds with similar average temperatures to Earth
might have extreme summers.
There is
some literature
exploring the absolute limits of temperature at which plants are
irreversibly damaged even in moist conditions that we can go off of
here:
-
35 °C: bleaching temperature of even heat-tolerant corals.
-
40 °C: tolerance limit for aquatic and undergrowth plants.
-
50 °C: tolerance limit for most plants with exposed leaves.
-
70 °C: tolerance limit for desert-adapted plants, and complex life
generally.
-
100 °C: water boiling point at 1 atm; tolerance limit for any life on
land.
-
120 °C: maximum
observed growth temperature
for microbes in high-pressure water.
-
150 °C:
limit of stability
for Earth-like biochemistry.
-
200 °C: maximum
observed survivable temperature
for microbes with brief exposure.
-
374 °C: boiling/critical point of water even at high pressure.
The actual temperature of the plant can depend on conditions like shading,
surface moisture, and time of exposure, which aren't always clear from
climate data, but we'll go by decent approximations anyway.
Even when not causing direct damage, high temperatures can also inhibit
growth: Photosynthetic productivity tends to rise with temperature because
it makes enzymes in the cell move and react faster, but at very high
temperatures two issues arise:
-
Transpiration rates become very high, such that even if there is
sufficient water in the soil, plants may not be able to transport it
to their leaves fast enough to keep them moist and continue producing
sugars.
-
Enzymes and other molecules break down, both slowing photosynthesis
and causing various other inefficiencies and requiring energy
expenditure for repair, to the point of offsetting energy gains from
photosynthesis.
These can be compensated for to varying extents by different
adaptations—such as C4
photosynthesis, which more efficiently uses CO2
inside leaves to reduce the need to open pores to intake more CO2, which is when most water loss occurs—but only to an extent.
The result is that most plants tend to achieve optimal growth at around 30 °C, and then growth rates sharply decline with higher temperatures until
reaching the compensation temperature, when energy loss to repair
or inefficiencies outweighs gains from photosynthesis and the plant can no
longer sustain growth. This is typically around 40 °C but potentially over 50 °C for heat-tolerant plants.
All this in mind, the safest approach may be to assume a degree of
symmetry with cold climates. We will assume that tropical plants on a hot
world can survive without significant damage up to a maximum temperature
of around 50 °C, beyond which more extensive heat tolerance adaptations are necessary,
forming a new climate group:
-
Hot (group H), with periods of intense heat.
Sufficiently high temperatures may then inhibit growth even among
heat-tolerant plants, creating a period of interrupted growth in summer
similar to that in winter for cold climates, and so a parallel sequence of
increasingly growth-restricted climates:
-
Supertropical (HT), with only brief growth interruptions,
allowing for evergrowth plants, named as the converse to subtropical
zones.
-
Swelter (HD), with longer growth interruptions potentially
favoring a more deciduous lifestyle.
-
Parch (HF), with a brief growing season to short for large
vegetation.
-
Hot Barren (HG), with a growing season too short for
almost any vegetation.

You'll note that, much as in arid climates, there's no direct
analogue to boreal climates here: Whereas plants in cold climates can keep
relatively low maintenance costs through winter thanks to low
transpiration and metabolic dormancy, plants in hot climates with long
summers must face high transpiration and heat stress throughout, and so
retaining soft tissue through summer would likely never be competitive
with deciduous plants even given very short growing periods. There might
still be some niche for highly conservative growth patterns in hot
climates, but because it'll be based on different dynamics of profits and
costs, I can't predict where exactly that will be, and we probably
shouldn't put too much faith in my estimates for hot growing temperature
limits anyway.
These zones can then be subdivided based on additional thermal
tolerances, in particular the 70 °C and 100 °C boundaries:
-
Hot Summer (Hxa) climates have summers within the range of
survival for complex life on Earth.
-
Torrid (Hxb) climates have summers beyond Earth's complex life
tolerances, requiring extreme adaptations to survive.
-
Boiling (Hxc) climates reach temperatures above boiling, fatal
for all exposed life incapable of surviving total desiccation.
Much as in cold climates, we'll keep the zone count down by trimming some
of the potential combinations:
-
Much like subtropical climates, supertropical (HT) climates will be
restricted to hot summers.
-
Swelter (HD) and Parch (HF) will both be split into all 3 categories,
which may be expressing a lot of optimism in the capacity for complex
life to adapt to extreme heat beyond the boiling point, but helps to
cover all our bases.
-
Hot Barren (HG) will remain undivided like the other barren
categories; it's unlikely to have only hot summers anyway.
Even if most of these assumed biome categories are broadly accurate for
alien worlds with hot summers, there's every chance that the specific
temperature thresholds won't apply consistently; other than the boiling
point, which few habitable climates are likely to reach and could vary
considerably with atmospheric pressure and altitude anyway, these
thresholds aren't linked to substantial physical barriers like the
freezing point; it's entirely possible that slightly different
biochemistry or evolutionary history might allow some alien life to
tolerate much greater (or less) heat or evapotranspiration, though because
many chemical processes tend to scale roughly exponentially with
temperature, there's at least some reason to hope the shifts won't be too
great.
The same pattern of semiarid, Mediterranean, and pluvial zones can also
be carried over, with 3 thermal categories for all because boiling summers
are likely to more fundamentally affect all types of hot biomes than
percontinental winters affect non-Boreal cold biomes. The interpretation
of "Mediterranean" is a bit peculiar here, though, because in H climates
the growing period is in the cooler part of the year, so our definition of
Mediterranean climates based on growing season precipitation favors them
in dry-winter climates here rather than the dry-summer climates of cold
Mediterranean regions. Still, in testing this system against some of the
high-temperature climate models
I've made in the past, I have found that this definition does correspond to restricted areas
with a specific pattern of particularly harsh winter or spring droughts
with heavy summer rains, which might indeed favor Mediterranean-like
biomes, so I'll include this "paramediterranean" category.

We can also add a couple of hot arid zones, but in parallel to cold
deserts, these will have a higher temperature threshold—torrid rather than hot summers—and here I will skip a separate boiling category, on the continued
presumption that desert life is going to be inherently more tolerant to
temperature extremes and will perhaps tend to have fewer exposed wet, soft
tissues exposed to high exterior temperatures and so will be less affected
by boiling temperatures.
Extraseasonal Climates
Finally, of course, a region could both have extremely hot summers and
extremely cold winters. There would likely be a separate set of adaptations
required to tolerate both extremes in the same year, marking out a distinct
set of biomes, forming another distinct group:
-
Extraseasonal (group E), with both periods of frost and periods
of intense heat.
We will, again, presume some overall symmetry with our cold climates,
though with the extra wrinkle here that these climates may face growth
interruptions in both summer and winter, with 2 growing seasons in between.
For both growth interruptions and growing season, I will presume that the
longest is always the most relevant to questions of biome transitions. In
any case, this implies our usual gradient of groups:
-
Extratropical (ET), with no substantial growth interruption in
either summer or winter.
-
Extracontinental (ED), with some period of extended growth
interruption.
-
Pulse (EF), with only brief periods of growth between seasonal
extremes, too short for large vegetation.
-
Extraseasonal Barren (EG), with growing conditions insufficient
for almost any vegetation, due either to temperature or light
restrictions.
There are many possible combinations of different tolerances or growing
seasons we could consider here, but we're rapidly running short of visually
distinct colors, so I'll keep this category small: there will be no
"extraboreal" category, and we'll use only two thermal tolerance
categories:
-
Superseasonal (Exa), with hot summers and cool winters.
-
Hyperseasonal (Exb), with either torrid summers or cold
winters, requiring more substantial adaptations to extreme temperature
tolerance.
Thus, there's some indication of more severe seasons, even if it may not be
obvious at a glance which season is the worst; hopefully in most cases this
will be reasonably clear from context. As per usual extratropical (ET) will
be restricted to superseasonal climates and we won't bother breaking up
extraseasonal barren (EG).
We can then carry over semiarid, extramediterranean, and pluvial zones as
per usual, and for arid zones we'll add an extraseasonal category but with
the particular requirement for both torrid summers and cold winters
(because arid zones with just one are already covered by the existing
categories).
Oceans
Though the main focus of this bioclimate system is on land areas, I do want
to give some consideration for oceans, so I might as well give them their
own designations
Ocean biomes are heavily influenced by factors such as seafloor depth, deep
water upwelling, and nutrient runoff from land areas that aren't well
represented by an atmosphere-only climate model like ExoPlaSim. We might be
able to guess at some of these factors in various ways, but to keep things
simple we'll stick to what we can determine based directly on climate data,
which ultimately comes down largely just to sea surface temperatures and ice
cover.
First off, of course, permanent and seasonal ice cover are fairly
straightforward data points that may influence both aquatic and semiaquatic
life:
-
Permanent Ocean Ice (Ofi), with permanent sea ice cover.
-
Seasonal Ocean Ice (Ofd), with seasonal sea ice cover.
Within ice-free waters, open oceans are largely uniform across climate
regions, but coastal waters are clearly divided into a tropical region where
coral reefs dominate and a cooler region where kelp forests and shellfish
beds dominate. Tropical corals can tolerate sea surface temperatures above
18 °C, though I've never found a clear answer for why, perhaps something to do
with water chemistry and nutrient availability. For what it's worth, the
extent of glass sponge reefs in the Jurassic seems to have reached to about
the same temperature boundary, as well as our geological record can attest,
so this doesn't seem to be a trait specific to modern Earth corals.
Heat-tolerant corals can survive up to 35 °C, with the mechanism there more clearly being damage to their symbiotic
algae, but corals or similar analogues seem to have been common in tropical
waters during substantially periods in the past (and ExoPlaSim again tends
to err high on equatorial temperatures) so I'll be more permissive and set
the high end of tropical ocean temperatures at 40 °C. To cover our bases, I'll add a zone where temperatures reach above 60 °C, about the maximum we've seen complex life tolerate for extended periods,
and a zone where temperatures vary between below 18 °C and above 40 °C (the former taking precedence over the latter):
-
Temperate Ocean (Oc), with sea surface temperatures dropping
below 18 °C but no sea ice.
-
Tropical Ocean (Ot), with sea surface temperatures remaining
between 18 and 40 °C.
-
Hot Ocean (Oh), with sea surface temperatures reaching above 40 °C.
-
Torrid Ocean (Or), with sea surface temperatures reaching above
60 °C.
-
Extraseasonal Ocean (Oe), with sea surface temperatures reaching
both below 18 °C and above 40 °C, but not above 60 °C.
In colder waters, you might expect ocean vegetation to show some
progression towards more growth-limited vegetation in colder climates just
as on land, but in practice
kelp forests
and open ocean plankton activity reach essentially right up to the edges of
the permanent ice sheets (or their former distribution, anyway), with no
clear zonation by latitude. Perhaps because frost damage and
evapotranspiration aren't issues, maintenance costs through winter simply
aren't a concern, especially compared with the strong influence of water
nutrient distribution. Still, photosynthetic life will need some light, so
for tidal-locked worlds or similar we can mark out permanently dark regions,
which will take priority over our temperature-determined zones (save that I
won't bother distinguishing dark and lighted permanent ocean ice).
-
Dark Seasonal Ocean Ice (Ofg), with seasonal ice cover and too
little ice-free light exposure for growth.
-
Dark Ocean (Og), with no ice and too little light for
growth.
That completes the system, bringing us to a grand total of 95 land zones
(65 without the pluvials) and 9 ocean zones. That's perhaps a bit more
sprawling than I originally intended (and trying to give all of these
recognizable, distinct colors was about as much of an ordeal as you might
imagine), but we're unlikely to see all these zones on a single world, so
that perhaps mitigates the complexity a little.
Climate Parameters
Now that we've got a conceptual sense of how we want to divide up our
climate zones, it's time to dig a bit more into the technical aspects of how
we can define them based on specific data. For a lot of the parameters we
want to use, availability and exact measurements may vary between sources,
so I'll mostly be focusing on how we can use ExoPlaSim data, which we'll
presumably be using the most, but I'll also discuss some potential
alternative approaches when working with more restricted data sources, to
the extent that in principle the whole system can be approximated from just
monthly average temperature and precipitation, the same as
Koppen-Geiger.
In general, I've tried to pick parameters with a mind to flexibility and
potential sampling issues. I've mentioned before that when working with
different year lengths, it's hard to know whether the months used as
sampling periods in Koppen-Geiger should best be interpreted as
corresponding more to a portion of the year or to an absolute length of
time; some definitions like the length of summer for subarctic zones should
probably be based on absolute lengths of time, but others based on extremes
of temperature should probably be scaled to the length of the seasonal cycle
such that short summer heat waves or winter chills aren't averaged out in
too large a sample. We've also seen a number of cases where the Xs/Xw
definitions become unreliable because they assume a simple seasonal cycle
with a single summer and winter or single wet and dry season (there's
sampling length issues there too, because they sample the wettest and driest
months of each season; too short a sample could be biased by a single heavy
rainstorm or dry spell, but too long a sample may miss real seasonal
variation). I don't think I can obviate the potential for sampling biases or
perfectly account for every seasonal cycle, but—aside from with temperature extremes where the length of these conditions
seems unimportant—I've tried to pick parameters that are a bit more continuous, looking at
variation in temperature or precipitation across the year rather than trying
to pick a single month or specific number of months as representative of the
entire cycle.
That said, though the motivation for the use of particular parameters has
been based on theoretical considerations, the choice of specific definitions
and thresholds will have to be empirically determined to best match actual
biome distributions, and there's even a degree to which definitions may have
to be tuned to specific data sources, which I'll make a note of in each
case.
There are a number of assumptions here that might be questionable,
especially where we're extrapolating to non-Earth-like climates, but because
I'm trying to avoid the use of indirect proxies, it's fairly easy to adjust
these assumptions if we like, and the koppenpasta script is also designed
to make that fairly easy (the thresholds are all listed at the front
of the Pasta_Alg
function, save for the GDD parameters which are in Biome_Param); if you're more optimistic or pessimistic about the ability for
vegetation to tolerate high temperatures, for example, you can directly
tweak the thresholds used, rather than having to work through any odd
indirect measurements.
Minimum Temperature (MinT)
Based on previous studies, the critical temperature thresholds in group C
should align with absolute minimum temperatures (MinT) of 0, -15, and
-60 °C. However, actual measurements of minimum temperature can vary considerably
depending on the exact methodology. For example, the Earth climate data I've
been using for reference seems to show some averaged daily low for each
month, rather than an absolute minimum. For ExoPlaSim, my best guess based
on what I know of the internal memory management is that data is collated
roughly every 5 days in-model, with the maximum and minimum temperatures
being the extremes within those periods, but then when data is collated into
months for output, the monthly values for max and min temperature are the
average for the results of these 5-day periods within each month. Thus, in
most cases they are also best regarded as representing typical daily
temperature variation rather than absolute extremes for the whole month. One
can force ExoPlaSim to output data in shorter intervals and then collate
that into months externally, but that's generally inconvenient in practice.
Even if we can properly measure the exact absolute minimum temperature in a
single year, occasional cold snaps every, say, 5 years could still impact
biome boundaries.
Thus, the thresholds of minimum temperature in these datasets that best
correspond with actual biome boundaries are generally higher than we
theoretically expect them to be, but we can accept that as a degree of
inherent error to the approach or perhaps even some error in our theory. At
any rate, I've decided on a set of tuned thresholds to be used for each data
source (which we can also use for the Woodward and Prentice et al. models).
I've also found monthly average temperature minimums that seem to correlate
to these absolute minimum thresholds, for cases where that's the only data
available.
|
Winter Type
|
ExoPlaSim MinT
|
TerraClimate MinT
|
Average Temperature
|
|
Mild
|
>10 °C
|
>10 °C
|
>17 °C
|
|
Cool
|
-10 – 10 °C
|
-4 – 10 °C
|
0 – 17 °C
|
|
Cold
|
-40 – -10 °C
|
-35 – -4 °C
|
-30 – 0 °C
|
|
Frigid
|
<-40 °C
|
<-35 °C
|
<-30 °C
|
To avoid potential confusion, for defining zones I'll use the names
specified above, saying e.g. "cool winters" to indicate a minimum
temperature that should be in the theoretical range of -15 to 0 °C, but can be tuned as appropriate for the data source. Thus, these
categories can be applied for various zones:
-
Mild winters for tropical (T) and hot (H) zones
-
Cool winters for oceanic (Cxa) and superseasonal (Exa) zones
-
Cold winters for continental (Cxb) and potentially hyperseasonal (Exb)
zones
-
Frigid winters for percontinental (Cxc) zones
One additional quirk for ExoPlaSim data is that it samples maximum and
minimum temperatures from the surface temperature, not the 2-meter air
temperature usually prefered for climate classification, so by default these
measures are all adjusted based on the difference between monthly average
surface temperature and 2-meter air temperature, but this can be toggled
with the temp_adjust_ts
setting.
For oceans, we shouldn't expect much daily or even
monthly temperature variation, so we can judge zones just by monthly
averages of surface temperature.
Maximum Temperature (MaxT)
Critical temperature thresholds in group T are set mostly by the
absolute maximum temperature (MaxT), similar to the above. There is,
however, not much good tuning data to go off of. We might expect that, as
with minimum temperature, the measured maximum temperature might fall short
of the actual absolute maximum, but ExoPlaSim seems to err a bit high in its
maximum temperatures and our estimated thresholds are imprecise anyway, so
we'll just go with our theoretical thresholds of 50 °C
for hot summers, hostile to most plant life, and 70 °C for torrid summers, hostile to even heat-tolerant life. For cases where
we have only monthly average temperature data, setting these thresholds
10 °C lower
seems like a decent approximation based on looking through previous
ExoPlaSim experiments I've done with high temperatures. Much as with minimum
temperatures, we can use more generic names for summer temperatures to avoid
confusion:
|
Summer Type
|
ExoPlaSim MaxT
|
Average Temperature
|
|
Warm
|
< 50 °C
|
< 40 °C
|
|
Hot
|
50 – 70 °C
|
40 – 60 °C
|
|
Torrid
|
70 – 100 °C
|
60 – 90 °C
|
|
Boiling
|
> 100 °C (or boil point)
|
> 90 °C (or boil point)
|
The boiling point is around 100 °C
at sea level on Earth, but can vary significantly depending on atmospheric
pressure, which varies with altitude and potentially between planets. Thus,
rather than assigning a single boiling temperature, if data on surface
pressure is available we can use the temperature and the
Antoine equation
to estimate a boiling pressure, below which water will boil. Sufficiently
low pressures can significantly lower the boiling point, e.g. to about
45 °C
at 0.1 atm, so on low-pressure worlds some areas may skip directly from warm
to boiling summers. In such cases I'll also take any definitions requiring
hot or torrid summers, e.g. Axh or Exb zones, to also be met if temperatures
exceed the local boiling point, regardless of how low it is.
The above temperature thresholds can still be used if no pressure data is
available, and this is toggled by the pas_boil_pres option.
-
Warm summers for tropical (T) and cold (C) zones
-
Hot summers for hot-summer (Hxa) and superseasonal (Exa) zones
-
Torrid summers for torrid (Hxb) and potentially hyperseasonal (Exb)
zones
-
Boiling summers for boiling (Hxc) zones.
Growing Season (GDD, GDDz, GDDl)
For measuring growing seasons, I'll again take inspiration from the
Prentice et al. model and rely on growing degree-days (GDD), where
every degree Celsius of the daily average temperature above a certain base
temperature is counted as one GDD, and this is summed across the whole year
(with no negative values counted for days averaging below the base
temperature). The idea is that plants will grow faster at higher
temperatures, so a short, hot growing season will support about as much
growth as a long, mild growing season, with the critical factor for biomes
being the total accumulated amount of growth possible in a single season.
The growth-temperature relation for most plants tends to be a somewhat more
complex curve, but this linear approximation works reasonably well when
considering whole biomes, averaging across different plants with different
optimal growth conditions.
GDD is usually measured on a daily basis, but of course ExoPlaSim and many
similar data sources only give us monthly averages for temperature. There
are ways to interpolate reasonable estimates of daily average temperature
from monthly averages, but they're somewhat computationally expensive, so to
keep things simple I'll measure growing degree-months (GDM) based on
the average 2-meter air temperature for each month, and then assume that 1
GDM corresponds to 30 GDD. This generally isn't exactly true, but
it'll be fairly close, and if we're tuning our definitions based on measures
of GDM then it shouldn't much matter.
The Prentice et al. model used a base temperature of 5 °C
for most of its GDD measures, so I'll do the same. However, we'll also have
to handle declining growth at high temperatures. Different plants have
different optimal growth temperatures, but again when considering whole
biomes and presuming that any particular region will already be occupied by
the plants best adapted for that climate, peak growth rates tend to be
achieved at around 25-30 °C.
Many measures of GDD will account for this by capping GDD counts at 30 °C, counting no additional GDD for temperatures higher than that; i.e., with
a base temperature of 5 °C, any day with a temperature above 30 °C
will always have exactly 25 GDD. But even higher temperatures of 35-50 °C can cause growth rates to decline or even stop, which generally isn't accounted for.

|
|
A typical temperature-GDD curve
|
To try to keep things simple, I will start with a base of 5 °C
and then assume that growth plateaus at 25 °C; i.e., growth rates are capped at 20 GDD/day. All temperatures between 25
and 40 °C will be counted as a uniform 20 GDD, and then GDD will be taken to
decline by 2 per °C above 40 °C, dropping to no growth above 50 °C. In reality growth rates at high temperatures could depend greatly on
atmospheric CO2
levels or the evolution of particular photosynthetic pathways, but this will
do for a simple approach.
 |
| The Pasta Bioclimate GDD curve |
(Note: when this post was first published I set these high thresholds at 35 and 45 °C, and the below maximum for GDDz at 55 °C, but after some more testing I decided to increase these all by 5 °C to make for a better tropical-hot transition).
Though there are some ambiguous hemiboreal forests, the temperate-boreal
transition generally falls at about 1300 GDD. The extent of tundra varies a
bit between sources, corresponding to either 350 or 500 GDD depending
largely on whether it is considered to include a strip of sparse trees on
the edges of the boreal forest, which I've also sometimes seen referred to
as its own distinct biome, "taiga savanna". I've opted to go with the lower
number here, if only because it somewhat compensates for ExoPlaSim's
tendency to underestimate polar temperatures and so overstate the extent of
tundra.
-
Below 1300 GDD for boreal (CE)
-
Below 350 GDD for tundra (CF)
-
The same 350 GDD boundary will be used for HF, TF, and EF as well.
But there are various special cases to account for. First off, the Prentice et al. model also included a second measure of GDD
with a base value of 0 °C, for dividing tundra from polar desert, reflecting how tundra plants may
be able to persist on meager growth performed at very low temperatures where
more warm-adapted plants have largely gone dormant. I'll use a similar
growing degree-day-zero (GDDz) measure here for much the same
purpose, but extend it out a bit to use for all the barren (XG) boundaries:
GDDz will be capped at 20 °C, for the same 20 GDDz/day maximum as regular GDD, and then taken to begin
declining at 35 °C at 1 GDDZ/°C, dropping to no growth at 55 °C, which thus represents my broad estimate for the maximum growth
temperature for even very heat-tolerant vegetation, based on that being
roughly the maximum temperature for which we see sustained activity by
complex life on Earth.
 |
| The new GDDz curve, in orange, compared to the regular GDD curve, in
blue. |
This single factor can then be used for all groups:
-
50 GDDz for dividing XF from XG in all groups
This ensures that, for example, at the terminator of a tidal-locked world
we should see a consistent transition to barren biomes across different
temperature regimes.
But that brings up our next issue: photosynthetic vegetation needs light to
grow as well as clement temperatures. On Earth, this isn't as important as
you might think: The rate of photosynthesis is bottlenecked by the chemical
process of carbon fixation, so most plants receive more light than they can
actually use. Towards the poles, winters can get fairly dim, but it
generally gets too cold for photosynthesis before it gets too dark. But, of
course, we can easily imagine other worlds—or just periods in Earth's past—with substantial areas that remain warm through periods of darkness.
Based on other models, the best approach here is likely to calculate
light-limited growing degree-days (GDDl) based on light levels, and
then take the actual GDD in each month as the minimum of GDDl and the
temperature-determined GDD (thus the resulting GDD count is determined by
the strictest limiting factor at any time, not any combination of the two,
which seems to match the best models of photosynthesis). The relationship
between light levels and photosynthetic rates is somewhat complicated but we
can make some rough approximations: the instantaneous rate of photosynthesis
rises
about linearly
with light level up to about 250 W/m2
of sunlight, beyond which there are diminishing returns as the process
becomes bottlenecked by the rate of chemical reactions rather than energy
input from light, with around 500 W/m2
being about the highest level with any benefit. When considering real
conditions where light varies throughout the day and exposure of individual
leaves to light varies, the dynamics are
more complex
but it seems that there is coincidentally a similar relationship where
overall productivity rises about linearly with daily average light radiation
up to about 200 W/m2, beyond which there are sharply diminishing returns; this conveniently
means that we may not have to worry too much about the difference between
rotating and tidal-locked planets. Below about 20 W/m2, typical large plants may not be able to produce enough from
photosynthesis to cover their respiration and maintenance costs, but some
marginal life can likely manage even with
very low light levels.

|
|
Typical relationship of net phosynthetic production to instantaneous
light irradiation (left,
Formighieri 2015) and daily average irradiation (right,
Rosati and Dejong 2003); 1 W/m2
of sunlight corresponds to about 2
μmol/m2/s or 0.17 mol/m2/d of photosynthetically active photons
|
Thus, for simplicity's sake we'll take GDDl to accumulate at a rate of 1
GDDl/day per 10 W/m2
of average daily radiation, up to a maximum of 20 GDDl, above a baseline of
20 W/m2 for limiting GDD and 0 W/m2
for limiting GDDz. This presumes an Earthlike relationship between total
light irradiation and photosynthetically useful radiation, so I'll add the gdd_par_ratio
setting to adjust the ratio of photosynthetic to total radiation (which is
about 0.5 for light from our sun) should anyone want to speculate about the
potential difference with the light spectra from different stars.

|
|
The GDDlz (orange) and GDDl (blue) curves.
|
For oceans, dark zones will be determined from GDDl directly (with the 0
W/m2
baseline), with no reference to temperature.
Finally, areas on Earth with cold winters consistently have one winter each
year, so if we count total GDD for the year we can assume it comes in one
long growing season. But on other worlds we could have more complicated
seasonal cycles with multiple potential growing seasons. Based on our
theoretical understanding of leaf growth patterns discussed before,
generally speaking the longest continuous growing season should be the most
important parameter, because it determines the maximum amount of stored
energy and resources that can be accrued before a period of interruption
where some resources must be spent either losing and then growing new leaves
or maintaining leaves through a nonproductive period. Thus, GDD will be
taken to accumulate until average monthly temperatures fall below 5 °C (or rise above 50 °C, or light falls below 20 W/m2), with the largest accumulation before such an interruption taken as the
total. If average temperatures remain above 5 °C
in all months, the GDD can be regarded as effectively infinite, because
vegetation can just continuously grow across years without having to accrue
resources to survive substantial interruptions. The same principles apply to
GDDz and GDDl for oceans, with their respective thresholds.
However, one change I've made since first developing this system is that for GDD specifically, the GDD count is interrupted during a period of no GDD accumulation only if this occurs during period when GInt, the growth interruption factor—which I'll describe in a moment—also accumulates to the threshold for a significant growth interruption, such that a brief period of low temperatures or light can't stop GDD accumulation. This mostly only makes a difference in a few edge cases where the sampling months are shorter than the day length, and is only applied to GDD, not GDDz or GDDl.
Which then leads us to the question of overall year length; I've speculated
before that longer or shorter years with correspondingly different growing
season lengths might be compensated for with different winter lengths to
store resources for, but our theoretical considerations so far seem to
indicate this is unlikely, as longer winters don't impose a particularly
higher maintenance cost. This may not hold for very long winters beyond any
seen on Earth, or for growth interruptions due to high heat or low light,
but that's largely just why I've excluded boreal analogues from such cases;
deciduous plants or annuals might be more capable of going dormant in such
conditions. At any rate, it does seem that growing seasons and growing
interruptions should best be counted in terms of absolute length in time,
rather than relative to the year. ExoPlaSim data doesn't contain detailed
time information, so instead I've added a prompt in koppenpasta to adjust
GDD counts based on a month length modifier, which represents the length of
each month in the dataset relative to a typical 30-day, 720-hour, Earth
month and is then used in the conversion of GDM to GDD (focusing on months
because koppenpasta counts growth parameters month-by-month and then sums
these without presuming any particular number of months or length relative
to the year); note specifically that despite "month" here refers to the
recording periods in the input data (though after any binning of months is
applied), rather than having any relation to a particular planet's moon or
calendar.
Finally, different environmental conditions or evolutionary history might
allow for substantially different growth rates on different worlds, even
without having to assume much difference in biochemistry. The chemical
bottleneck on carbon fixation rates I mentioned earlier appears to be
largely a consequence of Earth's high ratio of atmospheric O2 to CO2, making it difficult to specifically incorporate CO2
to drive the reaction forwards rather than accidentally using O2
and driving the reaction backwards; a world with different atmospheric
conditions might thus be able to achieve higher (or lower) growth rates, at
least in those marginal biomes where growth is restricted by growing season
length rather than nutrient or water restrictions. To account for this,
koppenpasta includes an additional option to apply a flat modifier to all
GDD counts (which stacks with the length multiplier).
Growth Interruption (GInt)
For this parameter, I'm moving beyond my examples in the literature;
various models do attempt to predict patterns of evergreen and deciduous
trees, but generally by modelling their growth rates in detail and comparing
their competitive advantages. Deciduous trees tend to use specific
temperatures to trigger leaf loss, but these are just convenient indicators
of the approach of winter and do not represent the root cause for deciduous
behavior or the more general subtropical-temperate transition, and in
general this boundary doesn't correlate well to any particular minimum
temperature threshold.
After testing a few different parameters, I've found that the boundary does
correlate well to what I'll call the
growth interruption factor (GInt), which works somewhat like GDD in
reverse: for each day with an average temperature below 15 °C, 1 GInt accumulates for every degree below 15 °C, to a maximum of 15 GInt/day at 0 °C (though much like GDD, I'll actually count GInt by monthly temperature
and multiply by the length of month). This means that, much like GDD
flexibly accounts for both long, mild summers and short, hot summers, GInt
accounts for both long, cool winters and short, colder winters; in essence
it's accounting for the accumulation of cold, low-growth conditions that
increase stress on subtropical plants, rather than defining winter by any
simple threshold.
-
1250 GInt for dividing XT from XD (or XE or XF) in all groups
-
The same 1250 GInt will divide TU from TQ
At high temperatures, I'll consider GInt to begin accumulating above
45 °C, to a maximum at 60 °C; this conveniently means that rather than having to count GInt
separately, I can simply count how much GDDz falls short of 15
GDDz/day. I'll presume the same GInt thresholds divides the hypothetical
supertropical climate, with tropical-like evergrowth vegetation, from hotter
climates that must adapt to prolonged periods too hot for growth. GInt is also counted after GDDz is limited by light levels, so dark periods
will be counted as growth interruptions as well.
 |
| The temperature-GInt curve
|
GInt will also be affected by the GDD month length and productivity
modifiers; longer months will accumulate more GInt just as they accumulate
more GDD and GDDz. But a greater productivity modifier reduces GInt, on the
presumption that if plants are innately more productive, they can tolerate
lower temperatures before their growth is seriously interrupted. So, for
example, if productivity is doubled, then temperatures have to fall below
7.5 °C (or rise above 52.5 °C) before GInt starts accumulating.
Also like GDD, if there are multiple periods of growth interruption divided
by months above 15 °C (or whatever the appropriate threshold is), the GInt total will be counted as the longest accumulation of GInt; and
if all months are below 15 °C, GInt will be taken as effectively infinite.
Note the implication that months between 5 and 15 °C accumulate both GDD and GInt, and a climate with all months in this
range can have infinite counts of both. This is fine as they're marking
separate biome boundaries caused by different ecological dynamics:
subtropical planets may
indeed still have some growth at moderate temperatures but temperate plants
more specifically adapted to such conditions will likely have a competitive
advantage, and a climate of constant mild temperatures may not have
deciduous vegetation but still have a distinct set of planet different from
subtropical and boreal climates.
Aridity (Ar, GAr)
For defining semiarid and arid biomes, I'll again be following Prentice et
al. in using an aridity factor (Ar) defined as the ratio of total
annual actual evapotranspiration (AET) to
potential evapotranspiration (PET). Note the quirk that an
arid climate actually has a very low aridity factor, but this
is in line with how "aridity" factors and indices are commonly defined in
research.
We can divide up our various levels of aridity thusly:
-
Above 0.9 Ar for tropical and quasitropical rainforest (TXr)
-
Above 0.75 Ar for seasonal forest (Xf)
-
Below 0.2 Ar for arid (A)
-
Below 0.06 Ar for hyperarid desert (Ah)
You'll note, of course, the gap in the middle there. As mentioned, dividing
moist and semiarid zones is best done by measuring aridity specifically in
the growing season, reflecting how the degree of growth possible in such
climates depends on how well precipitation and clement growth temperatures
coincide, to a greater extend than for very wet or dry climates. The
boundary is thus defined by growth aridity (GAr), which, rather than
comparing an equal average of AET and PET, compares averages weighted by the
GDD (i.e. the value of AET or PET in each month is multiplied by the GDD
count in that month, and then the resulting total for the year is divided by
total GDD; for simplicity's sake this is done with the raw total GDD count
without considering interruptions or multiple growth seasons); thus, the
conditions in months with more growth have a greater effect on the growth
aridity, and months without any growth aren't considered at all.
-
Below 0.5 GAr for semiarid (XA)
Because tundra and other XF zones take priority over XA (thus XA can only
occur where there is at least 350 GDD), there should always be some
significant growing season to use for counting this parameter where it is
relevant. The semiarid definition has priority over moister zones (an area
with below 0.5 GAr cannot be moist regardless of how high Ar is) and the
arid definition takes priority over semiarid (an area with below 0.2 Ar is
arid regardless of how high GAr is).
I debated for some time if using total annual ratios for all zones
was appropriate, as it generally seems that some biomes like rainforests are
bounded by the severity of seasonal droughts moreso than year-round moisture
conditions, but any measures I tried for monthly extremes of aridity or
accumulated drought conditions proved to be poorer fits for biome
boundaries, and didn't work terribly well in cooler climates where PET can
be very low in winter and so small variations in AET can drastically change
the monthly aridity factors. Using annual totals helps mitigate the
influence of such oddities or biases based on sampling periods, and the use
of AET in particular helps make this measure a more reliable indicator of
the consistency of water availability compared to similar measures of
precipitation/PET, which can be biased by heavy seasonal rains in a way that
can obscure the dry season. A substantial dry season will always clearly
reduce AET/PET regardless of how heavy rains are in the wet season, and
conversely brief seasonal rains will raise the ratio, but only so far for a
short burst of heavy rains in an otherwise dry climate (AET is also less sensitive to sampling periods, because evapotranspiration
rates are buffered by soil water storage so a short sample of a moist period
that happens to miss any heavy rain will still show high AET).
The main potential confounding factor is year length: a given period of
drought will have less effect on the annual AET/PET ratio for longer years,
even though it might have a similar effect on biome composition. But so far
I haven't come up with a good measure to account for that, and at any rate
we can probably expect longer years will usually come with accordingly
longer seasonal variations.
PET can be estimated a number of ways, a few of which I've implemented in
koppenpasta:
-
The
ASCE Penman-Monteith
method is a commonly used standard approach estimating PET from average
temperature, daily maximum and minimum temperatures, net surface
radiation (absorbed sunlight - emitted heat), relative humidity,
atmospheric pressure, near-surface wind speed, soil temperature, and
vegetation density, all of which can be directly taken or estimated from
ExoPlaSim output data; but should it be necessary, this method can be
run with just average temperature, net radiation, and relative humidity,
with all other values filled in with typical Earth averages.
-
The
Hargreaves method
is a much simpler equation using just average temperature, net
radiation, and optionally daily maximum and minimum temperature.
-
Finally, a very simple Koppen-alike method estimates PET based just on
monthly average temperature, as 7 mm/month per °C
above freezing, based on Koppen's 20mm/year/°C
threshold for aridity and a bit of tuning to best replicate the spread
of climate zones on Earth; the results are far from perfect but they'll
do as a backup of last resort (Note: when I first made this post I gave this at 4.5 mm/month/°C, but tuned it a but based on further testing).
AET is provided by ExoPlaSim data and many similar models, but where such
information is lacking we can try to estimate it based on precipitation and
PET with a simple model of soil moisture:
-
In each month, precipitation is compared to PET
-
If precipitation exceeds PET the excess is added to soil moisture, up
to a maximum soil capacity equal to 50 cm of rain (in reality this
varies considerably but this will do as an average); any extra water
past that is presumed to be lost as runoff.
-
Evaporation is then equal to PET
-
If precipitation falls short of PET, the deficit is removed from soil
moisture.
-
Drier soil causes slower evaporation, so once soil moisture drops
below 25 cm rain-equivalent, the total evaporation from soil is
limited to the minimum of either the total remaining soil moisture or
[ (PET - precipitation) * (soil moisture / 25 cm) ].
-
Evaporation is then precipitation plus soil evaporation.
-
Some soil moisture may carry across years, of course, so this algorithm
runs through the year until there's no more than 1 cm difference in soil
moisture between the start and end of the year.
This is essentially how ExoPlaSim determines evaporation rates internally,
the main difference being that the model calculates evaporation every
timestep while we're using monthly averages; so it'll be less accurate
(particularly with regards to soil evaporation rates) but will do as an
estimate.
Even with models that do provide evaporation data, this algorithm can be
useful for interpolation; ocean cells should of course always have enough
moisture to satisfy PET and so have an aridity factor of 1, but this may be
unrealistic for any islands too small to have appeared at the model
resolution but will appear in the interpolated map; so this routine can be
used on ocean cells to estimate the appropriate evaporation that should
occur in any land areas they contain, and that value used for interpolation;
this is on by default in koppenpasta but can be toggled with the evap_estimate_sea option.
Growth Supply (GrS)
This is the parameter I've chosen to define Mediterranean zones, and I'm
not exaggerating when I say I tested dozens of alternative approaches before
I arrived at this one. Growth precipitation (Gpr) is a GDD-weighted
average of precipitation, like those used for GAr, which here is compared to
the unweighted average of actual evapotranspiration (AET) to
determine the growth supply (GrS). The idea is that a low growth
supply ratio indicates that rains during the growth season only supply a
small portion of the total evapotranspiration, thus plants must rely mostly
on water stored in the soil or their bodies through the growing season,
creating the unique circumstances for Mediterranean biomes. This particular
combination with a weighted and unweighted average may seem peculiar, and
admittedly it's the most indirect parameter I'm using here, but it turned
out to perform substantially better than all the alternatives:
-
Comparing Gpr to a similarly GDD-weighted average of AET still somewhat
identifies Mediterranean regions, but also tends to include many
continental climates where AET sharply rises for a brief, hot period of
midsummer, but remains low through the rest of the year; these regions
can resemble Mediterranean areas in some ways, but because the period of
high evaporation is brief and soil water can accumulate to high levels
the rest of the year, water shortage isn't as much of a challenge in
these areas.
-
Comparing total yearly precipitation and AET is useful for pluvial
zones as we'll discuss shortly, but not Mediterranean zones, as it can't
show a seasonal deficit in precipitation, only a surplus.
-
Comparing precipitation to PET (or AET to PET) tells us if a region is
overall arid, but doesn't work well to show a seasonal mismatch in water
supply and consumption.
-
Comparing GAr to Ar (thus giving us some sense if the growing season is
drier or wetter compared to the average) had some promise but I couldn't
find any threshold that included patches of clear Mediterranean biomes
in Africa and Australia while excluding large areas of clear temperate
forests in Europe.
-
I attempted various approaches for measuring accumulated deficit of
precipitation relative to AET and similar measures, under the assumption
they would more directly indicate soil water conditions, but none proved
to be as good a match to Earth's Mediterranean biomes.
For data on Earth, a maximum GrS threshold of 1.15 reliably identifies
Mediterranean regions, implying that it is the norm for the average growing
season precipitation rate to exceed the annual average evaporation; but, as
has become clear through our explorations, ExoPlaSim has some innate bias
towards Mediterranean-like climate patterns, so if we tune this model a bit
to give the proper extent of Mediterranean regions in the baseline Earth
tests, a threshold of 0.8 seems to work better (and conveniently avoids the
potential for seasonless climates to be erroneously classified as
Mediterranean). As with the temperature thresholds, I'll simply refer to
"high" or "low" GrS in the zone definitions to allow for appropriate
tuning.
-
Low GrS for Mediterranean (XM) zones.
Evaporation Ratio (Evr)
This is the parameter for defining pluvial zones, and in contrast to the
above it's fairly straightforward: The evaporation ratio (Evr) is
defined as the ratio of total annual actual evapotranspiration (AET)
to precipitation (pr); i.e., it is the portion of precipitation that
remains and ultimately evaporates rather than running off (in principal AET
can also include external sources, but for pluvial zones this is likely to
be a minor influence).
A low evaporation ratio indicates that there is at least part of the year
where precipitation far exceeds PET, and this accounts for a substantial
portion of annual precipitation, which implies saturated soil and some
requirement to adapt to heavy rainfall and runoff and prolonged damp
conditions. As mentioned, this conveniently covers a range of different
special cases: in wet, warm climates, potential for soil degradation and
tropical heathland; in drier climates, heavy monsoons that help support
thicker forests; in colder climates, temperate rainforest or bogs that favor
taller, thicker forests. All these biomes even seem to be associated with a
similar evaporation ratio threshold:
-
Below 0.4 Evr for hyperpluvial rainforest (TUrp)
-
Below 0.45 Evr for all other pluvial zones (Xxp)
Ice Cover (MinIce)
Koppen-Geiger estimates ice cap extent by a hottest-month average
temperature of 0 °C, which is generally decent at large scales, but a monthly average of 2-meter air temperature is not a perfect
indication of frozen surfaces, and it's also possible for permanently
subfreezing areas to lack ice if there's never enough precipitation for ice
to accumulate. On Earth, this is limited to a few small valleys, but on a
much drier world they could be more extensive, and the CG zone gives us the
option to distinguish these areas from both proper ice sheets (CI) and
slightly more hospitable tundra (CF).
ExoPlaSim does give us some more direct data on ice cover. The glacial
model isn't entirely reliable, especially over the typically short runs of a
few decades or centuries at most (large ice sheets may take many thousands
of years to reach equilibrium between accumulation and ablation; one of
these days I may investigate using a more dedicated ice sheet model), but if
we combine that with snow depth data we can get a decent sense of which
areas are likely to accumulate ice in the long term. Thus, I'll use
ExoPlaSim's measure of snow depth (which includes glacial ice) and define
ice sheets based on the minimum ice cover (MinIce).
-
Above 10 cm MinIce for CI
For interpolation with temperature adjustment by topography, I'll have to
make some awkward adjustments; I'll presume that any areas with persistent
ice become none-iced if the absolute maximum temperature (unadjusted by the
surface temp/2-meter air temp difference) rises above 0 °C, and I'll add ice where the maximum temperature drops below 0 C and there
is at least some part of the year where ice accumulates to over 10 cm.
Sea ice cover is still defined based on fractional ice cover as reported by
ExoPlaSim:
-
Above 20% maximum sea ice cover for Of
-
Above 80% minimum sea ice cover for Ofi
But this also gives me an opportunity to fix a common interpolation issue,
whereby sea ice doesn't appear in some small waterways too small to have
appeared as sea cells at the model resolution and too far from any larger
bodies of water to be covered by the "dummy ice" hack (which gives any
coastal land cells the highest sea ice cover value present in any
neighboring sea cells); whenever these areas have some snow cover, we can
count them as having sea ice as well for interpolation purposes (for
simplicity in the algorithm I'll take 1 cm of snow as corresponding to 10%
sea ice cover, so 2 cm in at least 1 month is required for seasonal ice and
over 8 cm is required in all months for permanent sea ice).
But as backup options, I've also added the pas_ice_def option, which can be set to ice
for this ice-cover-based approach, ice_noadj
for the same but without any of the above temperature-related adjustments
when interpolating, tavg
for the former definition by average monthly temperatures, or maxt
for defining ice cover based on whether the maximum surface temperature ever
surpasses 0 °C. Similarly, for sea zones the sea_ice_use_temp
parameter can be used to toggle estimating sea ice as occuring where surface
temperature is below -2 °C (which applies to both the standard and Pasta sea
classifications).
You may note that, though I'm trying to choose the best data available from
ExoPlaSim, again the whole system can be derived from just monthly averages
of temperature and precipitation where necessary:
- Average Temperature
-
Estimate MinT using average temp tunings
-
Estimate MaxT using average temp tunings
-
Take 100 °C
as the boiling point (tuned as 90 °C average temp)
-
Calculate GDD and GDDz (from corresponding GDM) from
temperature
-
Calculate GInt from temperature
-
Estimate MinIce based on 0 °C threshold for land, -2 °C threshold for sea
-
Estimate PET as 7 mm/month/°C
- Average Precipitation
-
Estimate AET from precipitation and PET with simple soil water
model
-
Calculate Ar from AET and PET
-
Calculate GAr feom AET, PET, and GDD
-
Calculate GrS from precipitation, AET, and GDD
-
Calculate Evr from precipitation and AET
The Pasta Bioclimate System
Here at last is what the complete system looks like for Earth, using the
same
TerraClimate dataset
I used for the maps in part I (which doesn't include data on oceans):
We'll assess how well this reflects Earth's biome distribution in the next
post, but for now, for clarity and ease of reference here's the list of the
resulting zones, their individual definitions, any good examples on Earth,
and our general expectations for the biomes they should support. To avoid
excessive repetition, here's a couple common rules across zones:
-
All pluvial (Xxp) except for TUrp require below 0.45 Evr, and
nonpluvial zones are presumed to have higher Evr.
-
Peritropical (XT), moderate (XD), boreal (CE), and non-tropical
semiarid (CA, HA, EA) zones all require high GrS, dividing them from
Mediterranean (XM).
-
All moist land zones, which excludes arid (A), semiarid (XA), marginal
(XF), barren (XG), and ice (CI), require above 0.5 GAr.
-
All non-arid land zones except for XG and CI require above 0.2 Ar
-
All land zones except for A, XF, XG, and CI require above 350 GDD
-
All land zones except for XG and CI require above 50 GDDz
-
All land zones other than CI require above 10 cm MinIce.
-
Ocean zones operate on an exclusive set of rules, but similarly all
except for Ofi, Ofg, and Og require above 50 GDDl.
-
All ocean zones except for Of require below 20% maximum sea ice
cover.
Summer temperature, winter temperature, and Mediterranen GrS thresholds are
tuned by data input, but here again are the values I've established so
far:
|
Winter Type
|
ExoPlaSim MinT
|
TerraClimate MinT
|
Average Temperature
|
|
Mild
|
> 10 °C
|
> 10 °C
|
> 17 °C
|
|
Cool
|
-10 – 10 °C
|
-4 – 10 °C
|
0 – 17 °C
|
|
Cold
|
-40 – -10 °C
|
-35 – -4 °C
|
-30 – 0 °C
|
|
Frigid
|
< -40 °C
|
< -35 °C
|
< -30 °C
|
|
Summer Type
|
ExoPlaSim MaxT
|
Average Temperature
|
|
Warm
|
< 50 °C
|
< 40 °C
|
|
Hot
|
50 – 70 °C
|
40 – 60 °C
|
|
Torrid
|
70 – 100 °C
|
60 – 90 °C
|
|
Boiling
|
> 100 °C (or boil point)
|
> 90 °C (or boil point)
|
|
Growth Supply
|
ExoPlaSim GrS
|
TerraClimate GrS
|
|
Low
|
< 0.8
|
< 1.15
|
|
High
|
> 0.8
|
> 1.15
|
Here, now, is the actual list:
-
Arid (A)
-Below 0.2 Ar
-
Hyperarid Desert (Ah)
-Below 0.06 Ar
-
Warm Desert (Aha)
-Warm or hot summers and mild or cool
winters
-Sahara; Atacama; Sonoran Desert
Too dry for most
life, but may support burrowing or migratory fauna, and rare
rainstorms may bring bursts of growth.
-
Cold Desert (Ahc)
-Cold or frigid winters and warm or
hot summers
-Tarim Basin; Atacama Plateau
Substantial
periods of frost with some potential for snow, reducing
evapotranspiration stress but still providing too little moisture
for most vegetation, and with significant risk of frost damage.
-
Hot Desert (Ahh)
-Torrid or boiling summers and mild or
cool winters
Extreme summer heat may further reduce
habitability, but some life may survive through extreme
dormancy.
-
Hyperseasonal Desert (Ahe)
-Cold or frigid winters and
torrid or boiling summers
Extreme seasonal temperature swings
hazardous to most life, with periods of both frost and extreme heat;
may only be visited by migratory fauna or require extreme
dormancy.
-
Semidesert (Ad)
-Above 0.06 Ar
-
Warm Semidesert (Ada)
-Warm or hot summers and mild or cool winters
-Australian
Outback; Chihuauan Desert; Patagonia
Occasional rain supports
widespread grass, shrubs, and succulents, with accompanying
fauna.
-
Cold Semidesert (Adc)
-Cold or frigid winters and warm
or hot summers
-Central Asian northern desert; Gobi; Great
Basin
Deep frosts provide additional hazard, but cool
temperatures may reduce evapotranspiration, favoring seasonal
vegetation.
-
Hot Semidesert (Adh)
-Torrid or boiling summers and
mild or cool winters
Extreme heat may limit life to ephemeral
or migratory forms.
-
Hyperseasonal Semidesert (Ade)
-Cold or frigid winters
and torrid or boiling summers
Particular intense seasons favors
ephemeral, migratory, or adaptable forms.
-
Tropical (T)
-Warm summers and mild winters
-
Eutropical (TU)
-Below 1250 GInt
-
Tropical Rainforest (TUr)
-Above 0.9 Ar
-Amazon;
central Congo; Singapore
Consistent rain and growing temperatures allows for thick evergrowth
forests with layered canopies.
-
Hyperpluvial Tropical Rainforest (TUrp)
-Below 0.4
Evr
-Amazonas, Brazil; central Borneo
Mostly typical
rainforest, but extreme heavy rains give potential for significant
soil degradation, forming more open tropical heathland or bogs.
-
Tropical Forest (TUf)
-0.75 - 0.9 Ar
-Havanna,
Cuba; Abidjan, Cote d'Ivoire; Hainan, China
Moderate droughts
or a slight water deficit, commonly forming a semideciduous
forest.
-
Tropical Monsoon Forest (TUfp)
-Freetown, Sierra
Leone; Kochi, India
Heavy seasonal rains encourage a more
rainforest-like structure, but there may still be a drought
period.
-
Tropical Moist Savanna (TUs)
-Below 0.75 Ar
-Serengeti,
Tanzania; Cerrado, Brazil; Bangkok, Thailand
Significant
droughts but a wet growing season allows for lush savanna, woodland,
or scrub depending on soil, fire, and grazing conditions.
-
Tropical Moist Monsoon Savanna (TUsp)
-Conakry,
Guinea; Goa, India
Heavier seasonal rains encourage thicker
woodlands or full forests despite droughts.
-
Tropical Dry Savanna (TUA)
-Below 0.5 GAr
-Sahel;
Caatinga, Brazil; Deccan, India
Drier conditions create more
open savanna, woodland, or dry deciduous forest.
-
Tropical Dry Monsoon Savanna (TUAp)
-Mumbai, India
Heavier
seasonal rains encourage thicker woodlands or dry forests, though
with a significant drought period.
-
Quasitropical (TQ)
-Above 1250 GInt
-
Quasitropical Forest (TQf)
-Above 0.75 Ar
Heavily
forested with tropical vegetation, but significant periods of low
light or mild temperatures may cause periods of dormancy
-
Quasitropical Monsoon Forest (TQfp)
Heavy rains may
encourage a more rainforest-like structure.
-
Quasitropical Moist Savanna (TQs)
-Below 0.75 Ar
Significant
droughts but a wet growing season; may have varied savanna and
woodlands, but lower cold/dark period evapotranspiration may allow
for lusher vegetation, though dormancy periods may limit tree
growth.
-
Quasitropical Moist Monsoon Savanna (TQsp)
Heavier
seasonal rains encourages thicker woodlands or forests, especially
where they coincide with the growing season.
-
Quasitropical Dry Savanna (TQA)
-Below 0.5 GAr
Drier
conditions, but again likely to be less evapotranspiration in
non-growing periods.
-
Quasitropical Dry Monsoon Savanna (TQAp)
Heavier
seasonal rains encourage thicker woodlands.
-
Tropical Twilight (TF)
-Below 350 GDD
Marginal
regions near the terminator of tidal-locked worlds or other
light-restricted circumstances. Might support grasses, shrubs, or
other low vegetation optimized for limited growing conditions, but
without the need for broad environmental tolerances.
-
Tropical Barren (TG)
-Below 50 GDDz
Areas on the
dark side of tidal-locked worlds still kept warm by global heat
distribution; even with little precipitation, low evapotranspiration
will likely maintain damp conditions, possibly helping to support some
soil microbes, but likely nothing apparent above ground that could
support large fauna.
-
Cold (C)
-Cool, cold, or frigid winters and warm
summers
-
Subtropical (CT)
-Below 1250 GInt and cool winters
-
Subtropical Forest (CTf)
-Above 0.75 Ar
-Louisiana;
Parana, Brazil; south China
A long, wet growing season supports
thick evergrowth forest, but greater seasonality and occasional
winter frosts prevent development to the scale of tropical
rainforests.
-
Subtropical Monsoon Forest (CTfp)
-north Myanmar;
Batumi, Georgia; Kagoshima, Japan
Extremely heavy rains
support lush vegetation, but seasonal cold or dry conditions still
slow growth, preventing development of full rainforest
structure.
-
Subtropical Moist Savanna (CTs)
-Below 0.75 Ar
-Pampas;
Miombo; Ganges plain, India
Drier conditions transition to
savanna and woodland similar to tropical savannas, but cooler
conditions reduce the severity of the dry season, so may still have
full forests and lush undergrowth.
-
Subtropical Moist Monsoon Savanna (CTsp)
-patches in
north California, Albania, Nepal
Heavier seasonal rains may
favor thicker vegetation.
-
Temperate (CD)
-Above 1250 GInt and above 1300 GDD
-
Oceanic Temperate (CDa)
-Cool winters
-Delaware;
Belgium; Nanjing, China
Lush deciduous forests with
large-leafed undergrowth, but not as thick or tall as warmer
evergrowth forests.
-
Oceanic Temperate Rainforest (CDap)
-coastal Oregon;
west Ireland; Valdivian forests, Chile
Heavy rains support
taller trees and lusher undergrowth, potentially with more
evergrowths.
-
Continental Temperate (CDb)
-Cold or frigid winters
-Ohio,
USA; Belarus; Seoul, South Korea
Less diverse mixed
deciduous/evergrowth forests with harsher winters and more regular
snow cover.
-
Continental Temperate Rainforest (CDbp)
-Nova Scotia,
Canada; Ljubljana, Slovenia; highland Japan
Heavy rains may
support a lusher, taller forest, but cold winters limit
undergrowth density and overall diversity.
-
Boreal (CE)
-Below 1300 GDD
-
Oceanic Boreal (CEa)
-Cool winters
-Falklands;
Orkneys, Scotland
Evergrowth forests with mild winters,
allowing for somewhat more diverse vegetation, potentially with
some deciduous trees.
-
Oceanic Boreal Rainforest (CEap)
-Magellanic
forests, Chile; Reykjavik, Iceland; Ketchikan, USA
Heavy
rains and mild winters may encourage more deciduous varieties or
at least lusher evergrowths and undergrowth
-
Continental Boreal (CEb)
-Cold winters
-Edmonton,
Canada; Finland; Yekaterinburg, Russia
Typical polar
evergrowth forests, with uniform, conservatively growing trees and
little undergrowth.
-
Continental Boreal Rainforest (CEbp)
-Newfoundland,
Canada; Trondheim, Norway; central Austria
High
precipitation may encourage lusher undergrowth, but may also
manifest as heavy snowfall and significant spring melt.
-
Percontinental Boreal (CEc)
-Frigid Winters
-east
Siberia
Extreme frost in winter prevents survival of
evergrowth leaves, prompting switch to deciduous forests but still
with very conservative growth patterns.
-
Percontinental Boreal Rainforest (CEcp)
-patches in
Siberia
Rare on Earth but may be more common in a colder or
more seasonal world; heavy precipitation likely to manifest as
heavy snow, may lead to boggy, more open environment due to low
evapotranspiration.
-
Submediterranean (CM)
-Low GrS
-
Oceanic Submediterranean (CMa)
-Cool winters
-Seattle,
USA; Samsun, Turkiye; Christchurch, New Zealand
Moist enough
conditions to support thick forests, but drier summers still favor
patchier woodlands with a mix of deciduous and evergrowth
vegetation.
-
Continental Submediterranean (CMb)
-Cold or frigid
winters
-north Idaho; patches in Greece and Turkiye
Harsher
winters may encourage more exclusively evergrowth forests and more
limited undergrowth.
-
Cold Semiarid (CA)
-Below 0.5 GAr
-
Mediterranean (CAM)
-Low GrS
-
Oceanic Mediterranean (CAMa)
-Cool winters
-central
California, USA; Santiago, Chile; Sicily
The archetypal
mediterranean climate, with substantial summer droughts favoring a
mosaic landscape of trees, grass, and shrub, supporting a variety
of unique fauna.
-
Continental Mediterranean (CAMb)
-Cold or frigid
winters
-east Oregon; Tabriz, Iran; central Tajikistan
Colder
conditions may reduce diversity, but also tend to favor thicker,
more evergrowth-dominated forests.
-
Cool Dry Savanna (CAa)
-Cool winters
-Gran Chaco,
Argentina; Mopane woodlands; Jaipur, India
Savanna and
woodlands with scattered trees and brush or sometimes dry forest,
but not as productive as tropical savannas; though may also have
milder dry seasons.
-
Cool Dry Monsoon Savanna (CAap)
-patches in Oregon,
Spain, and Iran
Rare on Earth, indicates heavy seasonal
rains; may support thicker undergrowth and more tree cover.
-
Cold Steppe (CAb)
-Cold or frigid winters
-shortgrass
prairie, USA; south Ukraine; Inner Mongolia
Colder conditions
create more completely grass-dominated plains, with very few
trees.
-
Cold Pluvial Steppe (CAbp)
-patches in BC, Canada and
Afghanistan
Also rare; heavy seasonal rains may support more
vegetation and reappearance of trees.
-
Tundra (CF)
-Below 350 GDD
-
Oceanic Tundra (CFa)
-Cool winters
-south Tierra
del Fuego, Argentina; patches in Iceland and Alaska, USA
Too
little warmth for trees and widespread permafrost but fairly
consistent temperatures allow for tall grass and large shrubs.
-
Continental Tundra (CFb)
-Cold or frigid winters
-Baffin
Island, Canada; north Russia; Tibet
More seasonal climates more
typical of polar regions, with some grass, lichen, and shrubs, and
potentially migratory grazers, but little activity in winter.
-
Cold Barren (CG)
-Below 50 GDDz
-central Svalbard;
strips around Greenland ice sheet;
Regions of bare soil and rock
too cold for most vegetation but without permanent ice cover and so
possibly hosting some lichen or microbes; mostly around the edges of
ice sheets or in mountains, but could cover large portions of a very
dry planet.
-
Ice (CI)
-Permanent ice cover
-Antarctica; central
Greenland
Ice sheets and other glaciers, with no stable ground
for vegetation but potentially microbes or transient fauna.
-
Hot (H)
-Hot, torrid, or boiling summers and mild
winters
-
Supertropical (HT)
-Below 1250 GInt and hot
summers
-
Supertropical Forest (HTf)
-Above 0.75 Ar
A long, wet growing season favors
tropical-like vegetation, but adaptations to extreme heat are
required.
-
Supertropical Monsoon Forest (HTfp)
Heavier rains may
help mitigate heat stress of plants, though may make homeothermy
difficult for animals.
-
Supertropical Moist Savanna (HTs)
-Below 0.75 Ar
Transition to savanna or woodland with drier
conditions.
-
Supertropical Moist Monsoon Savanna (HTsp)
Heavier
seasonal rains may favor thicker vegetation and mitigate heat
stress.
-
Swelter (HD)
-Above 1250 GInt and above 350 GDD
-
Hot Swelter (HDa)
-Hot summers
Long periods of extreme heat may require
deciduous vegetation and dormancy, but are still generally tolerable
by complex life.
-
Hot Pluvial Swelter (HDap)
Heavy rains may favor
thicker vegetation and help mitigate summer heat stress.
-
Torrid Swelter (HDb)
-Torrid summers
More extreme
summer heat is more challenging to complex life, requiring either
more extreme dormancy, migration, or more fundamental biochemical
alterations.
-
Torrid Pluvial Swelter (HDbp)
Heavier rains may favor
lusher vegetation if summer heat can be tolerated.
-
Boiling Swelter (HDc)
-Boiling summers
Boiling
summer temperatures hazardous to life, potentially preventing
permanent habitation unless organisms can adapt to completely dry
out or shelter underground.
-
Boiling Pluvial Swelter (HDcp)
Heavier rains may
benefit any migratory or boiling-tolerant life, but high humidity
may also make homeothermy more difficult.
-
Subparamediterranean (HM)
-Low GrS
-
Hot Subparamediterranean (HMa)
-Hot summers
Drier
growing periods may favor a patchier evergrowth/deciduous mix, but
still allow for thick vegetation.
-
Torrid Subparamediterranean (HMb)
-Torrid summers
Hotter
summers may inhibit evergrowth habits and so reduce overall
vegetation.
-
Boiling Subparamediterranean (HMc)
-Boiling summers
Vegetation
may be limited to sparse, ephemeral forms.
-
Hot Semiarid (HA)
-Below 0.5 GAr
-
Paramediterranean (HAM)
-Low GrS
-
Hot Paramediterranean (HAMa)
-Hot summers
Droughts
during growth periods may require plants to specialize either in
growth during hot, wet periods or reliance on stored water.
-
Torrid Paramediterranean (HAMb)
-Torrid summers
Hotter
summers may limit viable rain-dependent growing season, increasing
dependency on stored water.
-
Boiling Paramediterranean (HAMc)
-Boiling summers
Extreme
summer heat may limit permanent vegetation.
-
Hot Dry Savanna (HAa)
-Hot summers
Summer heat and
evapotranspiration may reduce but perhaps not eliminate large
permanent vegetation.
-
Hot Dry Monsoon Savanna (HAap)
Heavier seasonal rains
may help mitigate heat stress and support more vegetation.
-
Torrid Steppe (HAb)
-Torrid summers
Extreme summer
heat and poor water availability may limit life to annuals or
migratory species.
-
Torrid Pluvial Steppe (HAbp)
Heavier seasonal rains
may allow for somewhat lusher vegetation, at least
seasonally.
-
Boiling Steppe (HAc)
-Boiling summers
Vegetation
strongly limited by heat and water availability.
-
Boiling Pluvial Steppe (HAcp)
Rains may favor some
vegetation depending on seasonal patterns of water
availability.
-
Parch (HF)
-Below 350 GDD
-
Hot Parch (HFa)
-Hot summers
Limited cool growing
periods, but moderate summers may allow for some permanent
vegetation.
-
Torrid Parch (HFb)
-Torrid summers
More extreme
summers may limit life to only small annuals.
-
Boiling Parch (HFc)
-Boiling summers
Largely
uninhabitable region with only brief hospitable periods.
-
Hot Barren (HG)
-Below 50 GDDz
Areas with no period
appropriate to Earth-like vegetation growth, may be occupied only by
microbes.
-
Extraseasonal (E)
-Hot, torrid, or boiling summers and
cool, cold, or frigid winters
-
Extratropical (ET)
-Below 1250 GInt, warm or hot summers,
and mild or cool winters
-
Extratropical Forest (ETf)
-Above 0.75 Ar
Thick tropical-like forests but adaptations required for strong
seasons.
-
Extratropical Monsoon Forest (ETfp)
Heavier rains
encourage thicker forests, but still inhibited by temperature
extremes.
-
Extratropical Moist Savanna (ETs)
-Below 0.75 Ar
Sparser
savanna and woodlands, potentially with complex growth patterns
around seasons and dry periods.
-
Extratropical Moist Monsoon Savanna (ETsp)
Heavier
rains support thicker woodlands and forest and may help mitigate
seasonal stresses.
-
Extracontinental (ED)
-Above 1250 GInt and above 350
GDD
-
Superseasonal Extracontinental (EDa)
-Warm or hot
summers and mild or cool winters
Likely deciduous forests
similar to temperate climates, but may have complex patterns of
vegetation growth and migration or dormancy to best take advantage
of growing periods between seasonal extremes.
-
Superseasonal Extracontinental Rainforest (EDap)
Heavy rains may allow lusher, potentially evergrowth vegetation,
though may favor life more tolerant to temperature extremes.
-
Hyperseasonal Extracontinental (EDb)
-Torrid or boiling
summers or cold or frigid winters
More severe seasons may favor
more evergrowth varieties or more complex patterns of deciduous
vegetation depending on the particular temperature range; likely
strong incentive for migration or dormancy in animals.
-
Hyperseasonal Extracontinental Rainforest (EDbp)
Heavy rains may help vegetation if timed properly to coincide
with growing periods.
-
Subextramediterranean (EM)
-Low GrS
-
Superseasonal Subextramediterranean (EMa)
-Warm or hot summers and mild or cool winters
Inconsistent
availability of moisture may limit forest cover or favor more
evergrowths.
-
Hyperseasonal Subextramediterranean (EMb)
-Torrid or boiling summers or cold or frigid winters
Potentially
patchier vegetation or more ephemeral life.
-
Extraseasonal Semiarid (EA)
-Below 0.5 GAr
-
Extramediterranean (EAM)
-Low GrS
-
Superseasonal Extramediterranean (EAMa)
-Warm or hot summers and mild or cool winters
may resemble
Mediterranean but with more migration, dormancy, or deciduous
habits, with life adapted to best take advantage of limited
windows of ideal growing conditions.
-
Hyperseasonal Extramediterranean (EAMb)
-Torrid or boiling summers or cold or frigid winters
Severity
of seasons may limit any permanent
-
Superseasonal Dry Savanna (EAa)
-Warm or hot summers and mild or cool winters
May have
scattered trees but more severe seasons may favor deciduous or
annual forms.
-
Superseasonal Dry Monsoon Savanna (EAap)
Heavier
rains may allow for lusher vegetation, at least seasonally.
-
Hyperseasonal Steppe (EAb)
-Torrid or boiling summers or cold or frigid winters
Severe
seasons and limited water availability may limit vegetation to
ephemeral forms like annual grasses.
-
Hyperseasonal Pluvial Steppe (EAbp)
Seasonal rains
may help bring greater blooms of growth, but temperature extremes
may still limit more permanent forms.
-
Pulse (EF)
-Below 350 GDD
-
Superseasonal Pulse (EFa)
-Warm or hot summers and mild or cool winters
Likely fairly
rare, may require short years; brief periods of growth between
seasonal extremes likely limit life to ephemeral and migratory
forms.
-
Hyperseasonal Pulse (EFb)
-Torrid or boiling summers or cold or frigid winters
Life even
more limited by seasonal extremes, though may have little impact on
already ephemeral vegetation.
-
Extraseasonal Barren (EG)
-Below 50 GDDz
Heavily
seasonal regions of the nightside of tidal-locked planets.
-
Ocean (O)
-Ocean areas
-
Cold Ocean (Of)
-Above 20% maximum sea ice
-
Permanent Frozen Ocean (Ofi)
-Above 80% minimum sea
ice
Permanent ice cover limits photosynthesis, but diverse life
may still exist below ice shelf.
-
Seasonal Frozen Ocean (Ofd)
-Below 80% minimum sea ice
and above 50 GDDl
Seasonal breaks in ice cover allow for more
photosynthesis.
-
Dark Seasonal Frozen Ocean (Ofg)
-Below 80% minimum sea
ice and below 50 GDDl
Ephemerally warm regions of the nightside
of tidal-locked planets.
-
Dark Ocean(Og)
-Below 50 GDDl
Unfrozen oceans in
warm regions of the nightside of tidal-locked planets, lacking
photosynthetic life but possibly supporting other ecosystems.
-
Cool Ocean (Oc)
-Below 18 °C
minimum surface temp and below 40 °C
maximum surface temp
Lack of ice allows for uninterrupted growth,
but waters are too cold in winter for coral; coastal waters dominated
by flora like kelp or shellfish.
-
Tropical Ocean (Ot)
-Surface temp always between
18 °C and 40 °C
Stable water temperatures support corals or similar life in coastal
waters, forming high-diversity shallow reefs.
-
Hot Ocean (Oh)
-Above 18 °C
minimum surface temp and 40-60 °C
maximum surface temp
Conditions too hot for corals, may be
inhabited by more warm-adapted species.
-
Torrid Ocean (Or)
-Above 60 °C
maximum surface temp
Surface temperatures for at least part of
the year exceed limits for complex life, though this might be avoided
by diving into deeper waters.
-
Extraseasonal ocean (Oe)
-Below 18 °C
minimum surface temp and 40-60 °C
maximum surface temp
Warm but variable oceans, challenging for
sessile shallow water life.
The full scheme is implemented in koppenpasta, with a few different
variants:
The land zones can be implemented as the full set, without pluvial zones,
limited to Earthlike zones (no hot, extraseasonal, or quasitropical and no
light restrictions on GDD), or Earthlike without pluvial, as shown
below:
The sea zones can similarly be implemented as the full set, Earthlike-only
(no dark, hot, torrid, or extraseasonal), or limited to only show ice
cover.
For now, there's only a single standard color set, but I may add more in
the future.
But that's a matter for another time. In Part III, we'll go over these maps
in more detail and discuss how well this scheme represents Earth's
biomes—and how well ExoPlaSim replicates those patterns—then look back at all our previous explorations and see how this new scheme
helps to highlight their various peculiarities.
But before that, one last little detour:
Unproxied Koppen-Geiger
Though I thought the isues with applying Koppen-Geiger to other worlds ran
deep enough to merit building this whole new system, I aslo figured that it
would be useful to have an option to still use the same classical set of
Koppen-Geiger zones, but with the definitions adjusted to more directly
reflect the parameters more fundamentally linked to biome distribution
rather than the proxies from the original scheme.
Many of the zones can share the same parameters as used for the Pasta
system and and can share some of the same thresholds (and thus the same
tunings for different data sources), though I've tweaked them in a few cases
to better match the original distribution of Koppen zones. The tricky bit is
that the Xxa and Xw categories don't clearly correspond to any of the biome
boundaries I identified for tuning my system.
Despite some of the names used, Xxa doesn't quite correspond to subtropical
climates and is perhaps best interpreted as indicating a long growing season
which might better allow for multiple crop harvests, something I didn't
identify in my system because it doesn't much impact natural biome makeup
but can be easily enough pinned to a high GDD count here. Incidentally, note
that for this scheme GDD and GDDz aren't given any high-temperature cutoffs
(i.e. any temperature above 25 °C
always gives 20 GDD, because there's no hot zones we could transition
to.
Xw is a bit more of a challenge, because as mentioned it doesn't correspond
too well to any actual biomes. I considered just switching it to represent
pluvial zones, but after playing around with a few parameters I found I
could get a decent match to the original Xw distribution by defining it in
terms of the ratio of GAr to Ar; what that means practically I couldn't
quite say but it should at least be a little more flexible with different
seasonal patterns and sampling periods.
- Mild winters for A
-
Above 0.92 Ar for Af
-
Above 0.85 Ar or below 0.45 Evr for Am
- GAr > Ar for Aw
- Below 0.32 Ar for B
-
Below 0.14 Ar for BW
-
Mild or cool winters for BXh
- Cool winters for C
- Low GrS for Xs
-
GAr/Ar > 1.02 for Xw
-
Over 2300 GDD for Xxa
-
Over 1300 GDD for Xxb
-
Cold or frigid winters for D
-
Frigid winters for for Dxd
- Otherwise as for C
- Below 250 GDD for E
-
Above 10 cm MinIce for EF
The results definitely aren't a perfect match for the original but do
generally seem to capture the spirit, if that's what you're looking for.
This alternate scheme is implemented in koppenpasta with all the subtypes
and color options as for regular Koppen-Geiger.


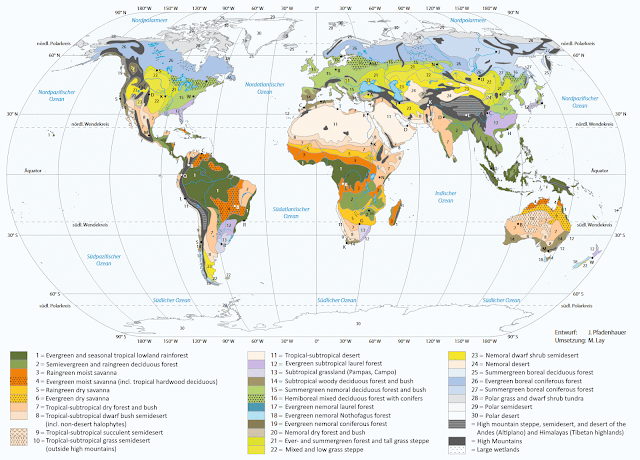


For ExoPlaSim Köppen climate maps you’ve already been commissioned, will you be allowing the recipients to have their maps converted to this new climate system with their data without starting a new commission?
ReplyDeleteIf I still have the data files to hand, it shouldn't be too hard to make a new map, and i usually keep them for a while
DeleteIt'd be very based if you redid the previous climate maps with koppenpasta climates, to get an even more precise idea on what these weird climates look like.
ReplyDeleteThat's pretty much the idea of Part iii
DeleteThis is great!
ReplyDeleteWhere is steppe-tundra (or mammoth steppe) https://en.wikipedia.org/wiki/Mammoth_steppe in your classification system?
ReplyDeleteI suspect they'd probably be some mix of cold steppe, cold semidesert, and continental tundra, but maybe at some point I'll dig up some climate modelling of the LGM and see how that turns out
DeleteFor such a simulation global average temperature should be as close to 7.8°C as possible. This is the temperature scientists have found out from climate proxies.
DeleteOh I'm sure there's data from a better model of the LGM somewhere out there rather than trying to run one myself
DeleteI got my 7.8°C number from here:
Deletehttps://bigthink.com/hard-science/just-how-cold-was-the-ice-age-new-study-finds-the-temperature/
You might be able to contact Jessica Tierney to get her data.
This is an interesting system, but I think some of the absolute temperature extreme based thresholds need reworking, as applying them strictly leads to results considered 'impossible' by the Pasta system as described. For instance, much of the US Southeast is prone to sporadic but intense cold snaps that lead to temperatures at or even well below the -15 C boundary of the CT subtropical zone. Earlier this year, an unusual snowstorm (events like this take place a few times per century) led to -16 C temperature reports in Lafayette and New Iberia, Louisiana, deep within the CT zone; further north in its northwest corner near Tulsa, such temperatures take place every winter with an all-time low of -27 C.
ReplyDeleteLikewise many areas shown within the tropical zone have records of frost, as in northern Australia and the Florida peninsula.
This may be an issue in the theory as the mean minimum temperature of months in data don't always correspond well to all-time lows. Maybe a yearly absolute minimum may be in order?
On the hot end, there's a lot less data to judge because the moist adiabatic lapse rate of Earth's atmosphere sets a hard limit to the maximum achievable temperature in anything but extremely dry climates/seasons. For this reason, the hottest non-arid temperature measurements have all been in Mediterranean-type climates (49.6 C. in Sidi Slimane, Morocco; 49.6 C in Lytton, BC, Canada; 50.3 C in Kairouan, Tunisia, possibly some slightly higher values on the fringes of the zone near the Dead Sea (51.2 C in Qalya, West Bank; 50.6 C in Kirkuk, Iraq). This may change slightly with global warming allowing these regions to get above 50 C Tmax for the first time. Such areas, particularly northern outliers like Lytton (and the rest of the lower Fraser valley) may barely qualify as ''extratropical' as a result.
Well yes, the absolute minimum ever recorded in a regions history isn't necessarily going to be too relevant to typical vegetation patterns, I suppose I didn't specify that it should be something like a yearly minimum, or the average absolute minimum across several years. Occasional cold snaps every few years can have some influence, but we can take yearly minimum as a bit of a proxy for that, because in practice we usually only have data on one year, or an average of multiple years; the Earth data I've been using is a 30-year average of 1981-2010, and for my climate explorations I usually use 10-year averages, but I think most people using this for their own ExoPlaSim runs usually just take the last year. The overall approach here really is a theoretical/empirical mix though, there are theoretical reasons to believe biomes should be more sensitive to winter night minimums than monthly average temperatures, but the exact temperatures used to define bioclimate zones are tuned based on real biome distribution, so I'm not necessarily depending on that exact -15 C figure being a strict limit.
DeleteWe might get some hot or extratropical climates in the future with climate change, but not necessarily all that much, the warming will be pretty concentrated towards the poles and even as the tropics get warmer it's hard to push up that maximum; but I did a few tests on some paleoclimate models and it does looks like there have been significant such regions in some of Earth's greenhouse periods, and based on a quick look around the literature it seems to be a bit of an open question whether direct heat stress was ever a limiting factor on vegetation at these times (as opposed to greater aridity or ecological shock from climate change that might accompany high temperatures).
In the summer of 2021 Lytton broke the Canadian record for highest temperature three days in a row. On the fourth day most of the village was destroyed by a wildfire. I don’t think such a quick sequence of events would have been possible without global warming.
DeleteI think that it wouldn't be possible for planet to have torrid oceans in a long-term. I read somewhere that once ocean surface temperature surpasses +50C it triggers massive evaporation of ocean water and the planet loses oceans and enters supermoist house state.
ReplyDeleteAnd at such temperature water would also regularly trigger formation of hypercanes which would affect entire planet.
DeletePossibly, I've heard similar estimates for the point of moist greenhouse runaway, though it probably depends on a number of factors and the figure refers to an annual average whereas the definition here only requires it pass 60 C for some part of the year. But with a lot of the more extreme hot climates I'm sorta just covering my bases even if they're not likely to turn up too often.
DeleteSpectacular work! Because I'm a sucker for complexity, any thoughts on a couple other extremes? 1) You allude to soil leaching from excessive rain, but is there an interesting region of "too much rain" short of "I guess this area is just underwater now?" Much like heat, I don't think it's a major limiting factor absent the soil leaching on Earth, but I could imagine something like a mountainous island in the tropics of an island world having absurd rains 2) Sustained windspeeds? I imagine you'd get interesting adaptations as winds crank up, and eventually an inability to maintain even heavy, wet soil.
ReplyDeleteI suppose the issue there is there's no clear examples or research to go by to know how to define any biome transitions around those; even in hyperpluvial rainforest only a small area actually gives over to heathland or bogs, there's no clear threshold of rainfall that's a serious problem for vegetation on Earth and it'd be hard to know how to assess if there is any such threshold elsewhere (in principle I suppose enough cloud cover would just inhibit photosynthesis, but that's already accounted for in GDD light limitation); for wind, that affects vegetation growth in some highland biomes, but that seems to have as much to do with how much the terrain exposes vegetation to direct wind as with any specific threshold of wind speed.
DeleteTo be honest, though, the number of zones I added was limited as much as the number of visually distinct colors I could find as the number of potential factors I could think of, and I also didn't want to end up like thornthwaite with thousands of unique climate zone designations that no one can remember the meaning of.
Wow, an amazing system! It seems like it tends to put patches of Mediterranean as a transition between steppes and east-coast humid regions: Would you say that this is representative of those areas' ecology, or just an edge case of how the classification system works?
ReplyDeleteI'll examine how well this system predicts Earth's biomes in detail in part III, but in general they seem to be an okay fit, e.g. that patch in Texas corresponds to a region of cedar savanna similar to typical Mediterranean mosaic vegetation
DeleteHow would a ‘tropical Mediterranean’ climate classify under your system? (winter low temp. = 18°C, summer high temp. = 30°C, summer rainfall is near 0 but at least 4-6 months in the winter and autumn get at least 60-150mm of rain per month, Think Tenerife but more rainfall in the rainy months, enough to change the classification to tropical)
ReplyDeleteProbably dry or moist savanna depending on the exact water balance; the general presumption is that the alignment of moisture and thermal seasons is less important in tropical climates because there are good growing temperatures year-round and so plants can just grow whenever water is available, as opposed to temperate climates where the mismatch in periods of water availability and growing temperatures is more of a challenge; though the fact that dry and moist savanna are divided by growth aridity reflects that there is still some advantage to good alignment between high rainfall and ideal growing temperatures.
DeleteI'm wondering if there's a better way to define coniferous temperate forests vs deciduous ones than GDD. There's places on Earth that have GDD's well below the <1300 threshold for boreal climates that are dominated by deciduous trees (Mountains of northern Japan, Kamchatka, lots of interior North Asia and North America), and others with over 2000 GDD dominated by conifers (U.S. / Canada West Coast). It seems to me the larger factors more conducive to a coniferous forest are low minimum temperatures during the growing season, and a dry summer rainfall pattern. It also seems like that for a given GDD, climates with colder winters have much shorter and smaller trees than climates with warmer winters, even when the warmer-winter climates have the same or shorter growing season. I believe the precursor to this post tried to address this by trying to match climate zones more strictly to biomes, but none of the maps really defined this difference very well
ReplyDeletehttps://www.nature.com/articles/s41477-023-01543-5 - Closest study that tried to compare and evaluate factors, but a lot of the data is wrong as to what leaf type is dominate in some regions
https://docs.google.com/document/d/1AIEphKVpYvQeskAn3jOPzcSG52kCf4tjQ00HrsYLgfY/edit?usp=sharing
https://www.nature.com/articles/s41477-023-01543-5
I don't think any of these definitions are perfect matches to the biomes they describe, partially because that isn't possible to achieve from climate alone; with the temperate-boreal transition in particular, poor soil quality favors evergreens a bit more and there's also a significant influence of biogeographic history, in particular the distribution of forest refuges during the LGM and patterns of recovery since then. You might still be able to get a better match by accounting for a few more seasonal factors (it's also notable that a lot of the "problem" regions are pluvial zones, so I think something about heavy rains or snows and frequent cloud cover complicates the competitive dynamics) but then the issue is how you extrapolate that to all the different types of seasonal patterns we might encounter on the different worlds we want to explore, or potentially even different types of alien vegetation.
DeleteSo for now I tend to think that even though growing season isn't the only factor on the position of the temperate-boreal transition, it probably is the dominant one that's most likely to carry some shared meaning across worlds even given very different global climate forcings and evolutionary histories.
Tree refugees explains why there are no indigenous deciduous trees on New Zealand. This despite its currently mild climate. Due to the small size of this landmass deciduous trees could not escape equator-wards during the last three ice ages.
DeleteThis phenomenon also explains the surprising prevalence of conifers in the tropical forests of Central America. While the climate of the area remained warm throughout the ice ages it was considerably drier. Probably a lot of savannahs but no significant amounts of jungle. Conifers could have survived in the highlands and some broadleaf trees along rivers. Parts of the Amazon was able to uphold itself during the ice ages. (At least some rainforest trees produce substances increasing the chances of rain.) However, drier and/or cooler areas in present-day Venezuela would have made it hard for the life-forms surviving there to reach Central America.
DeleteI think there should be a minimum length of time that has to pass without any accumulation for GDD, GDDz, and GInt to be reset (or maybe just specifically GDD when it reaches 0 due to there not being enough light) no matter the month length. As they are currently defined, a planet with a day length of over 10 Earth days, and a month equal to a NSTPW interval of around 5 days to keep maxT and minT accurate, ends up with regions of tundra at the equator where months that entirely happened during the night are common enough to interrupt GDD accumulation. As far as I could tell, these areas weren't any different from the adjacent subtropical forest (and on my planet both became oceanic temperate when GDD and GInt were allowed to be non-continuous), except for how the day/night cycle synchronised with the months.
ReplyDeleteI understand that this is somewhat of an edge case, and for me it could be mostly solved by turning off the setting that requires GDD to be continuous in the script, but it's easy to image a planet for which that wouldn't work well. Binning the months wouldn't work, since if I understood that part of the code correctly minT and maxT are averaged the same way as all the other variables, which defeats the purpose of having the shorter months. I also think the bioclimate system should properly account for this, since it might be relevant in other situations as well, and one of the goals for the bioclimate system was to be mostly independent of chosen month length. I completely understand if its too infrequent of a situation to have the definitions of things made more convoluted to account for though.
Also I'm really sorry for leaving comment this long for a fairly minor issue, I think the pasta bioclimate system is excellent, this was just an issue I encountered and I wasn't sure where else to put this.
Hmm, I had been a bit worried about that but I'd presumed that it wouldn't turn up much because you need to have a high GInt to get to the point where GDD becomes relevant, which thus already implies a substantial cold/dark period. There could of course be cases with long GInt in one part of the year and short GDD interruptions at another point, but that I did think would be a rare edge case (to be sure, have you been setting an appropriately short month length in the script?). I also considered some requirement that GDD can only be interrupted in periods of appropriately large GInt, but it seemed tricky to implement reliably, especially if you also want to consider the reverse case of whether GInt should be interrupted in short warm periods that accumulate little GDD.
DeleteWhile I'm at it, I could probably also implement an option to preserve extremes of temperature and ice cover when binning months together, but that's just avoiding the issue here a bit, because it's effectively just deciding that GDD interruptions have to last at least an Earth month and I don't have an obvious reason for why that specifically should be the case.
I set my month length to 0.167, which sort of caused the problem, since I think with a longer month length over 350 GDD builds up before being interrupted in the relevant places. I ran the program again with both a month length of 0.167 and 1 to verify I hadn't made a mistake, and the tundra areas don't exist with a longer month length.
DeleteI had assumed that while subtropical climates take priority over boreal when the requirements for both are met, tundra takes priority over subtropical, which would explain why I had no boreal (or temperate) transition zones between the oceanic tundra and subtropical forest despite having an interpolation factor of 8. Is this not the case?
I planned to include the relevant output images in this comment in case they were helpful, but the online image hosting site I found doesn't seem to work properly.
I'm not sure if this will be useful, but just in case it helps reproduce the issue or figure out what is going on, here are some relevant outputs of the script and factors of the simulation I ran:
Delete(the resolution for these may be strange, I had to adjust it for the site to work)
https://postimg.cc/SJCWKcZb (the original climate map, has regions of tundra in the tropics in Africa and South America)
https://postimg.cc/dkTrbCp1 (version with a month length of 1, lacks tropical tundra)
https://postimg.cc/2b6ryFrk (version with GDD allowed to be non-continuous, lacks tropical tundra)
https://postimg.cc/2qKLzxZY (land chart for the original climate map)
https://postimg.cc/S2VMBpfZ (version using the koppen climate system and a bin size of 6. Has regions of temperate oceanic that approximately correspond to the regions of tundra in the pasta climate system. I have some theories as to why, but none entirely make sense.)
timestep=45
runsteps=9600
'NSTPW@plasim_namelist':'160'
times=60
year=300
rotationperiod=11.2
obliquity=19
pCO2=0.118 and a total atmospheric pressure of around 1.3 (These significantly reduce daily temperature variation, and from previous testing seem to have an approximately equal effect. I didn't adjust the GDD productivity modifier to account for the increased CO2)
The land mask and heightmap are the exoplasim defaults, since the original purpose of the simulation was to test the climate parameters independent of specific terrain.
I'd intended for subtropical to take priority over tundra, the logic being that without a sufficient growth interruption subtropical can just keep growing across growth periods even if they're short, but it doesn't look like I did that ordering properly. So I'll probably fix that, and add an option to preserve extremes across binning, and the more I think about it I probably also can implement a filter to only interrupt GDD in periods of sufficient total GInt.
DeleteWhat would a climate that combined the rainfall/seasonal patterns of Sintra, Portugal with Santa Barbara, California's typical temperature range fit under in this system for mapping?
ReplyDeleteSomewhat bizarrely specific question, and they already have pretty similar climates, the main difference being just that Sintra is a tad wetter through the warmer months and so falls into cool dry savanna (CAa) rather than mediterranean (CAMa)
Delete>bizarrely specific
DeleteI've got a decent chunk-sized area of "mild, often sunny but lush, four seasons" like a mix or a warmer version of aquitane/southeastern france covering a bit of geography in oneo f my settings so I just needed an idea of which to put there or at least what direction to look into.
Impression I'm getting from rereading it/your reply is quasitropical moist savanna or Subtropical Moist Monsoon Savanna is closest. Thanks!
The Azores is considered tropical? Why? Wouldn’t they be subtropical or warm mediterranean?
ReplyDeleteThey have pretty mild seasons and days, and so never get particularly cold
Delete“Quasitropical” and “extrasesonal” are quite good concepts for describing the climates of my high axial tilt world. I wanted to create a world with the following characteristics:
Delete¤ An axial tilt of 81 degrees.
¤ An atmosphere humans can breathe without too much trouble.
¤ No equatorial ice belt.
Later I decided it to have the following properties:
¤ 80% of the Earth’s radius.
¤ 94% of the Earth’s gravity.
¤ A rotation time of 23 hours.
¤ An orbital time of 353 days.
¤ An orbital eccentricity of 0.033.
The result was a fairly warm world with an average temperature of 23°C. This is due to a combination of slightly higher insolation and much stronger greenhouse effect. Native plants are a little more heat tolerant than their Earth equivalents but not much. Most would still die from overheating at 50°C. A small number of extreme plants can cope with up to 60°C. Some are annual plants growing closest to the poles where the seasons are the most extreme. Others are thorny or ephemeral plants growing in the deserts.
I don’t have the opportunity to use any climate simulation. So I assumed rotational time to matter more for circulations cells than axial tilt. Polar nights are assumed to be dry unless drops in temperature triggers precipitation. There is also a monsoon effect at the poles as both are on land. The northernmost continent has an additional monsoon providing summer rain between 20th and 55th parallels.
Within the 12 degrees of the equator there is no polar night (although there might be midnight sun). Still, the sun is low in the sky around the solstices. Temperatures in this area keep 0 – 30°C with two warmer periods and two colder ones per year. Frost is uncommon below an altitude of a kilometre or so. There are rains year-round but the amounts vary with temperature. I imagine the vegetation as dense evergreen forest. Maybe something with leaves like rhododendron might work?
Between 12th and 30th parallels there is a short period of polar night. The lowest yearly temperature is towards the end of this period. Still it is usually above freezing. There are two periods with average temperatures of 30 – 40°C a year. One is before the summer solstice and one just before the autumn equinox. As amounts of precipitation decreases I imagine a change from deciduous forest to savannah to treeless grassland to scrubland to desert. Around 25th – 30th parallels there are two considerable areas below sea level. These only have ephemeral plants due to the extreme heat.
At 30th parallel frost starts to occur regularly even in the lowlands. The summers are now warmer even outside the deserts with temperatures of 40 – 45°C at peaks being common. Around 40th parallel the second temperature peak shrinks and further polewards disappear. This situation with a short period of randomly occurring frost continues to 50th parallel. I used to think about the climate of these areas as subtropical:
https://en.wikipedia.org/wiki/File:Subtropical.png
Around 35th parallel any desert not in rain-shadow gives way to scrubland as there is some precipitation in spring. Between 40th and 60th parallels there are extensive grasslands with pulse-like climate. These areas get reliable rain in spring even in many inland areas. Precipitation in summer is unreliable and autumn is about half polar night. So it does not provide much in the way of growing season.
At 60th parallel longer periods below freezing at the end of the polar night are normal. Summers does not get warmer but get more precipitation. I imagine something resembling conifers growing denser in even rainier areas. Most between 75th and 80th parallels are deciduous forest. The local trees can both exploit the heavy rains in summer and cope with temperatures below -15°C in winter. The most extreme climate is within 10 degrees from the poles. These get up to 60°C in summer and down to -40°C in winter. As a consequence of this they have only annual plants.
I should correct myself. Only areas within 5° of the equator are imagined as evergreen forest. Between 5th and 10th parallels differences in precipitation over the year grows larger resulting in deciduous forest. Between 6th and 12th parallels there is midnight sun but no polar night due to the thicker atmosphere. From 10th to 30th parallel precipitation gets lower and more seasonal. Most deserts are centred around 30° north and south. The largest continent have a considerable area in rain-shadow. It has a young mountain chain to the east and a rift valley to the west. As a result the desert reaches 40° north and scrubland 45°. This is the northernmost desert on the planet.
Delete‘Moist savanna’ (in the Hersfeldt bioclimate classification) is probably my favourite climate, especially if it’s on an island.
ReplyDeleteUnderstandable, as Moist Savanna is the climate humanity is best adapted for. I think people are attracted to the sea because it over-triggers our desires for open landscapes.
DeleteWhat climate do areas like Bermuda and Pitcairn island have in your system? They get just about enough rain and heat to have an Af tropical rainforest climate, but they’re very close to be considered subtropical or even just oceanic. They’re also not overly wet compared to other areas with a rainforest climate.
ReplyDeleteI think they mostly end up as Tf here, wet but not rainforest.
DeletePasta, you are my favorite content creator!!!
ReplyDeletehttps://chelsa-climate.org/downloads/
ReplyDeleteI have found this, but it doesn't have minimum annual temperature, surely it must be out there somewhere? Technically this source could be used to calculate it programatically but it's a bit annoying to have to download daily data to do so
Also it seems your model fails for southern Central Asia? It's cold/hot semi-desert but seems fairly barren IRL?
ReplyDeleteI get more annoyed from the Caspian Sea not being shown.
DeleteSo far as I can tell there's pretty widespread shrub cover across Turkmenistan and Uzbekistan, if anything I feel like there might be a tad too much hyperarid desert in Iran and Pakistan but I had to tune it against semidesert spread in Arabia. The Caspian Sea thing is just a common quirk of climate databases, it's sort of counted as a lake for masking purposes.
DeleteBeing the world’s largest lake makes this “quirk” rather visible.
DeleteCan you clarify better how the aridity factor is calculated? I've tried doing 2 methods:
Delete1. Sum up AET and PET for the entire year and divide them
2. Calculate an average of the monthly ratios of AET and PET.
Both methods produce similar results, the first being closer to your results but I'm really not sure I'm missing something.
Nevermind, ignore my comment above. I just spent 3 hours trying to understand what you were doing and somehow missed the fact you explicitly state it's the annual ratio
DeleteAnd the fact that the Caspian has significant climactic effects. Look at the much smaller (even before the 1960s) Aral Sea.
DeleteYou are right in that temperature swings in the area have become larger from the drying up of the Aral Sea. The presence or absence of the Caspian Sea would have quite large effect since it is five or six times larger by surface area.
DeleteYou said that H climates are not expected in an Earth like planet
ReplyDeleteHowever when you made the climate map of the Earth at 20°C , there's a small area in Bolivia that has a Supertropical moist Savannah (HTs) . You mentioned that these H climates are for planets with high average temperatures, but the Earth's average temperature as an average is around 21°C which does have HT climates,so maybe H climates are to be expected on an Earthlike planet ( at the very least HT climates )
Also maybe you should give subtropical,temperate and boreal climates their own unique starting letter rather than C , like:
Subtropical-S
Temperate-C ( To match koppen climate )
Boreal - B
So that it is easier to know what climate your looking at at a glance ( since these climates are really different from each other )
Earth's average temperature is currently 15 C, and at any rate exoplasim seems to be a tad biased towards hotter tropical climates than reality. Whether Earth can be said to have any H climates at all maybe depends a bit on the exact dataset used, but at any rate there are no large areas of it currently.
DeleteWell I agree but still the temperatures do align during hothouse periods so this isn't a rare climate type just saying
DeleteCan you please answer my second question?
DeleteI dunno, I don't particularly feel changing the main designations at this point and thus having to go back and alter every image I've made to this point. The top-level groupings sort of classify each zone based on the main climate factor restricting each area from reaching the assumed tropical ideal; excessive cold, excessive heat, both, or restricted moisture. Subtropical, temperate, and boreal regions are different but still all represent various degrees of the same "problem" for plant life. I did choose the second letters to sort of allow you to drop the C when just discussing only earthlike zones, but admittedly that doesn't work quite so well with semiarid zones.
DeleteHow though?
DeleteWhat climate would a consistently dark but warm place have; not warm enough to be tropical (in which case it would be tropical dark) but above 0°C? Climate is humid but not pluvial.
ReplyDeleteThat would be CG, cold barren, which in this case essentially acts for a catchall for areas of below-tropical temperatures that are for one reason or another are unsuitable for vegetation but not covered in ice.
DeleteI have a question about how GDD and GInt work for different day lengths. I mean, 60 24h-long days with a temperature of 5C surely are a greater interruption than 60 6h-long days with that temperature. Does GDD just use Earth days? Also, when days get very long, the day-night cycle essentially becomes a seasonal cycle of its own. How is this accounted for?
ReplyDeleteThe idea is that it should be based on absolute time than the actual rotational period, yes, the "day" in "growing-degree-days" is 24 hours; and in practice koppenpasta really works with growing-degree-months (720 hours), because that's what exoplasim provides, with a routine to adjust for different lengths of sampling months. For long days, that's part of why I added the requirement for a sufficiently long interruption period (at minimum about 80 days of total dark or subzero temps) to stop GDD accumulation, the idea being that just as subtropical biomes on Earth can tolerate winters about that long without needing any special adaptations for dormancy, they could probably do the same with nights. There's plenty reason to be skeptical how well that works for various special cases, but it's as best I can do just extrapolating from Earth's patters.
DeleteAre the hot (H) climates >50°C maximum any time at all or is it based on a mean monthly temperature at least 1 month >50°C
ReplyDeleteI think it is monthly means since record highs and lows don’t matter for vegetation.
DeleteFirst of all I really enjoy this mini-series it was something I was looking for and was very interesting, overall though I think it's a bit complex, as many of the parameters can't easily be distinguished by looking at climate data, given this you think you could come up with some rough parameters that could be easily distinguished using a standard climate data table, as currently it is very challenging to place locations under a certain climate due to complex factors like the aridity index
ReplyDeleteWould average daily minimums or maximums over a month be of use for this system?
ReplyDeleteThat is effectively what MaxT and MinT are in practice, the way Exoplasim works it samples the maximum and minimum temperatures within 5-day periods and then averages those results for each month (this isn't really intentionally designed this way, it's just a result of the memory management), so those should be pretty close to the average daily highs and lows for the month.
DeleteBecause things like the polar vortex or heat waves won't affect vegetation as they are extremes
DeleteHello,
ReplyDeleteI think the cold/frigid winter divide shouldn’t be limited to just CE climates. If the general idea is that -40 MinT is the limit beyond which no exposed soft tissue can survive, this should have a significant impact on most life
CM/CAM: frigid winters force a switch to deciduous leaves similar to CE.
CD: since most trees are already deciduous in CDb, the main effect would be limiting herbaceous plants to annuals.
CA/CF: since these already can’t support any large woody plants, it would limit most plants to annuals
And what about impacts on animals? As for humans, exposed skin can freeze in a matter of seconds at -40 C. I can imagine this being a big problem for other animals as well.
I understand that the limited number of available colors is an issue, but i think there should at least be CMc and CAMc
So I was looking at the letter codes for each biome and a few things I would change myself to allow for each biome to fit under multiple different classifications:
ReplyDelete* Hot Oceans (Oh) and Torrid Oceans (Or): Technically, both oceans would fall under the hot (H) category, so I'd instead use the codes (Oha) for Hot Oceans and (Ohb) for Torrid Oceans. Hot and Torrid already use the (xxa, xxb, xxc) qualifiers. So for there being 2 hot oceans, I'd feel that this also makes sense.
* Warm Semidesert (Ada) and Warm Desert (Aha): Since hot, cold, and extraseasonal deserts already use the codes (h), (c), and (e), I would use the code (t) instead of (a) for warm deserts, as "A" is not used as a first letter code. So I'd have Warm Semideserts as (Adt) and Warm Deserts as (Aht).
* Frozen Oceans (Of) and Ice caps (CI): These use 2 different letters (f) and (I), but I would use the same letter (i) and (I) to indicate ice cover. (f) is already used to indicate tropical forests. I'd change Permanent Frozen Oceans (Ofi) to (Oiy), with "y" reflecting year around ice; as (p) is already used to mark "pluvial". I'd switch Seasonal Frozen Oceans (Ofd) to (Oid).
* All Barren climates: The capital letter "B" is unused, and so I'd switch all barren biomes over from (G) to (B): Dark Ocean (Og) to (Ob), Dark Seasonal Frozen Ocean (Ofg) to (Oib), Tropical Barren (TG) to (TB), Cold Barren (CG) to (CB), Hot Barren (HG) to(HB), Extraseasonal Barren (EG) to (EB).
* (CE) Boreal biomes: (E) is ambigous with (E) Extraseasonal, and so it could be confused with "Cold Extraseasonal", when (CA) represents "Cold Arid". Boreal biomes can instead use (N), which is unused, (I would use B for barren biomes, N for boreal biomes could indicate needle based evergrowths). So I would change Oceanic Boreal from (CEa) to (CNa), Continental Boreal from (CEb) to (CNb), and Percontinental Boreal from (CEc) to (CNc).
* All XF based biomes: Since I'd switch all barren biomes from the letter code (G) to (B), I'd switch all tundra based biomes (F) to (G) for the same reason as frozen oceans. I wouldn't want to use F for tundra biomes as these biomes don't have forests. So I would change: Tropical Twilight (TF) to (TG), Oceanic Tundra (CFa) to (CGa), Continental Tundra (CFb) to (CGb), Hot Parch (HFa) to (HGa), Torrid Parch (HFb) to (HGb), Boiling Parch (HFc) to (HGc), Superseasonal Pulse (EFa) to (EGa), and Hyperseasonal Pulse (EFb) to (EGb).
We sorely need percontinental temperate climate. It may not be possible on Earthlike planets but it can easily exist. The most obvious case this would apply to is high latitudes on planets with very long years, keeping GDD high despite the summer being overall a small portion of the year, but you could also have it in a fast-rotating planet arranged such that an area is tropical for most of the year but when the polar band reaches it it has a short intensely cold winter.
ReplyDeleteI excluded a percontinental temperate zone not because Earth lacks it but there's no clear reason the frigid winters threshold would affect presumably deciduous vegetation.
DeleteTemperate zones don’t always have deciduous vegetation. As an example, in the 30x longer day simulation there are large areas of CDb in the tropics, which are below the 1 250 GInt threshold but are classified as CDb due to cold nights. I can’t imagine these having deciduous trees as there is very little time to grow new leaves. My guess is they would be similar to Earth’s taiga but perhaps with more undergrowth.
DeleteA switch from cold to frigid nights would prevent the survival of evergreen leaves. Such climates would experience temperatures too cold for evergreen leaves but not enough time to grow deciduous leaves and so may be quite barren, with only some ephemeral low plants.
If they normally get snow before their nights get frigid they could be treeless plains or tundra-like.
DeleteI've been trying to fix the GDD threshold to make the 1901-1930 maps accurate, but I can't fix the 1901-1930 maps without lowering the GDD threshold down to 1160-1195 ish. I already cut the GDD from 1300 to 1225, which allowed me to fix 55% of the southward error in the boreal-temperate position in the 1901-1930 map. But lowering the GDD threshold to 1160-1195 would break the 1931-1960 maps for the percontinental boreal zone, which requires a GDD of 1225 to avoid breaking the 1931-1960 map. But I don't see any good reason to break either the 1901-1930 map or the 1931-1960 map. So if there was a better way to go around the percontinental boreal category, I'm not sure what second restriction or criteria to set for either percontinental boreal or for the temperate category to separate the two.
DeleteMy best guess is to use the GDDz parameter to add a second "gate" to the temperate category, by using GDDz to estimate "the intensity of the above freezing period" and if there are not enough time above freezing, require a high GDDz before the "percontinental boreal" category flips to "temperate". For example:
Inside the percontinental zone, you can accumulate 1275 GDD and a 1940 GDDz. However you could also have an oceanic zone with winters of -3C monthly mean with 1205 GDD and 2230 GDDz. However, in the oceanic zone, you don't need that high of a GDD to flip to "temperate". A GDD of 1160-1200 would do. But in the percontiental zone, you need a higher GDD, perhaps above 1300, because of permafrost constraints, before flipping over to "temperate". However, GDDz does not work if winters have above 0C monthly mean, so the GDD count is still needed to calculate the boreal boundry in oceanic winter conditions.
I've been testing GDDz and GDD across the 1901-1930 and 1931-1960/1940-1969 maps, I'm thinking either 1150 or 1160 GDD with a GDDz cutoff of 1975 (a soft indirect proxy for percontinental boreal, but no change to the order of operations and no new parameters, only existing parameters may be reused) to maintain continiuty in the percontinental boreal zone until the year 2001-2004 ish; are close to the correct thresholds to calibrate the 1901-1930 and the 1931-1960/1940-1969 maps correctly. I'm testing 2 different data sources for 1901-1930 against the 1931-1960 map and the 1961-1990 map.
DeleteAfter more testing, I'm thinking 1150 GDD + 1975 GDDz for the temperate-boreal transition does the job of restoring the original temperate-boreal boundry in the 1901-1930 maps, allows 1931-1975 maps to be acceptable but only okay, and then anything after 1975-2005 ish is allowed to shift northward. But the southward bias in the 1901-1930 Pasta map was not something that I could be okay with, since there is no southward bias in the 1901-1930 Koppen map as 1901-1930 was the reference time period in which the Koppen map was calibrated.
DeleteA couple of thoughts on nomenclature. I would get rid of the "paramediterranean" and "extramediterranean" terminology and just call all the climate types with a dry growing season and a wet non-growing season mediterranean; "oceanic mediterranean", "torrid mediterranean", "superseasonal mediterranean", etc. already get the differences across well enough. I understand you want to be clear when the relevant dry season is winter instead of summer, or spring/fall, but compounds like "hyperseasonal subextramediterranean" don't really clarify anything IMO. The climate zone names can't really be short, but they should be as short as reasonable.
ReplyDeleteThe other one is "extracontinental", which, aside from being long, is in your use not actually analogous to "continental" - you're using "continental" to refer purely to the coldest temperatures during winter, analogous to "torrid" or "hyperseasonal", while "extracontinental" is the equivalent of "temperate" and "swelter" with an intermediate-length growing season. So, for example, if you wanted to talk with more specificity about hyperseasonal climates, you'd get terms like "torrid oceanic extracontinental" or "hot continental extracontinental". I'd change the naming of that climate type to something shorter, although I'm not really sure what - "swinging" is the best I could think of.
Also, what about a quasitropical mediterranean/submediterranean category? I know you're low on colors, but this would be only two more, and would logically follow from the other mediterranean types - a climate where it never gets below freezing or above the hot-climate threshold in a typical year, but where it's dry during the growing season and dark during the rainy season, creating problems for vegetation. Whereas the other distinctions within hot and cold climates depend on maximum or minimum temperatures and thus don't apply to quasitropical, except the ones you've already included.
So I've done some extensive testing of the Pasta Biome Sysrtem, and I ran the script using the Beck et' al 1901-2100 maps, as well as using the ERA5 reanalysis dataset.
ReplyDeleteThere is a problem with the Pasta temperature thresholds when using the monthly average max and average min. Since the terra option lacks a threshold for the H and E biome class. If I use monthly averages which uses 40C, then the 2070 maps output H and E biome zones in India. But they disappear when using the "terra" option using monthly avg tmax and tmin, because it's using the absolute max of 50C, not monthly tmax.
I added a threshold for H and E biomes at between 45-48C and tested it using both the 1991-2020 files, and the 2070 data files. The H and E biomes require the threshold be set to 46C or above when using the terra dataset. Using the ERA5 dataset seems to have a wet bias across the map, and so I had to raise the H biome class threshold from 46C to 48C to eliminate the H and E biomes from the 1991-2020 ERA5 maps using the Pasta biome system. However, since there is a patch of H and E biomes in India in the 2070 map when using the "tavg" option with monthly mean of 40C , I cannot set the threshold above 48C when using average tmax and tmin with the terra option. Using 49C will remove H biomes outright from India in the 2070 maps.
Therefore, I would suggest that a dedicated avg tmax threshold for "Hot" and "Torrid" be added to the main default source code for the Pasta biome system when using the terra dataset. For H and E biomes, the Tmax threshold should be set as 48C as the default. 50C is the absolute max, which can't be the monthly average maximum, as the monthly average maximum has to fall short in order for 50C to be the absolute max. The 48C threshold ensures all 1991-2020 Pasta biome maps do not display H and E biomes, but they may start to appear in the 2001-2030 maps, and are absolutely present in the 2070 maps. However, there is still room for debate whether the 48C threshold can be lowered to 47C. 46C monthly tmax for H and E biomes is a bit too low but some room for debate, and 49C is far too high.
Now, with adding a dedicated "torrid" tmax threshold when using the terra dataset, the maximum average tmax is around 56-59C using the 2070 version of the terra dataset. The average monthly mean tops out around 46C when using both terra and the Beck et al 2070 datasets, about 14C short of "torrid". The avg high is about 10C higher than the avg mean temp, but the absolute high is only 3C higher than the monthly average high. The 1991-2020 ERA5 renalysis has max avg highs of 47.5C, and absolute highs of 50.6C.
Thus, I would suggest adding a "torrid" threshold for the terra dataset. I would recommend setting it anywhere between 64 and 67C. I went with 64C for monthly average tmax when I set the threshold for H and E biomes to be 48C. This places the "torrid" threshold about only 8-11C higher than the max average tmax, and I'm erring on the side of 64C over 67C.
This comment has been removed by the author.
DeleteHow many PPM of carbon dioxide does the 2070 simulation presuppose? We can’t know how much it will rise in the next 45 years.
DeleteSo I finally got around to generating the Pasta system map using the WorldC 2.1 dataset from Feck et al., as well as using the Chelsa dataset.
DeleteOne extra wrinkle with these 2 datasets is that they don't have the latest 1991-2020 data nor have 1961-1990 data available, and they come in TIFFs rather than nc files, and so needed conversion to nc files first (the Chelsa dataset needed to be downscaled to 4km resolution as well) in QGIS. The Chelsa dataset has a unique quirk in that PET data is available, but not AET, and so AET needed to be estimated manually within koppenpasta even though PET data was available. There's also another quirk in that both ERA5 and Chelsa only have PET for some land areas, but not all land areas. So for areas with no PET data, I opted to just estimate PET with the kalike 7mm to avoid erroneous outputs of 1.0 Ar; and areas with pre-existing PET data, I just use it as is.
I have found that a GrS of 1.0 when using the kalike 7mm toggle for PET will always produce the correct Mediterranean biomes regardless of the dataset. This is true for all 5 datasets I have generated Pasta biome maps for (Beck et al, WorldC, Terra, Chelsa, ERA5). As such, I would recommend fixing the GrS threshold to 1.0 when the kalike 7mm toggle and "estimate evap all" toggle are both enabled and used to calculate PET and Mediterranean biomes in the Pasta system.
One other issue is that upon additional testing with the Chelsa dataset using pre-existing PET data, is that a GrS threshold of 1.15 is a very poor indicator of Mediterranean biomes in the Chelsa dataset. Once I discovered this issue, I opted to revisit the Pasta map outputs from the ERA5 dataset to further review the Mediterranean GrS issue, as the ERA5 outputs had a similar issue but not as severe as Chelsa. I tested a GrS of 1.15, 1.10, 1.05, and 1.00 for the ERA5 and Chelsa datasets using pre-existing PET data. I found that both 1.15 and 1.10 GrS causes Mediterranean biomes to over-proliferate (mostly in Queensland, Uruguay, central Africa, Mexico, India, Kazakhstan, and Wyoming). The Chelsa dataset using pre-existing PET data needs GrS to be decreased to at least 1.05, if not 1.00. ERA5 could go either with 1.05 or 1.00 for GrS. So the 1.00 or 1.05 GrS maps were what I could decide as final for ERA5 and Chelsa. I’m a bit surprised that a GrS of 1.00 results in pretty identical Mediterranean biomes whether kalike is toggled on or if pre-existing PET data from ERA5/Chelsa is used. Because of so, I decided to keep the 1.00 GrS maps when using pre-existing Chelsa/ERA5 PET data, as the final Pasta biome map for Chelsa and ERA5. I could see a pretty good case for using a GrS of 1.05 for the Chelsa dataset using pre-existing PET data, and a bit so for ERA5, but the case for ERA5 as not as strong as with Chelsa. I mostly wanted a consistent, standardized GrS across all 5 datasets. A GrS of 1.15 seems to be only good for the Terra dataset using pre-existing PET data.
The Beck et al and the WorldC 2.1 datasets have no PET data available, but for Chelsa, ERA5, and the Terra datasets, I’ve found that the kalike 7mm toggle tends to increase Mediterranean zones on the western coasts, and remove Mediterranean zones from eastern inland areas. Using pre-existing PET data for Chelsa, ERA5, and Terra removes Mediterranean biomes from western coastal areas, but causes eastern inland Mediterranean biomes to proliferate. The issue of Kazakhstan being covered with Mediterranean biomes is highly present using ERA5 data (ERA5 has a wet bias, and so Mediterranean biomes outputted by ERA5 are shifted eastwards too far inland than they need to be), and it is simply impossible to remove it.
Following up with my prior comment (re-editing upon additional testing with WorldC and Chelsa). When I used the Terra, ERA5, (and now the) WorldC, and Chelsa datasets, there are patches of Quasitropical Forest (TQf, TQfp), Quasitropical Moist Savanna (TQs, TQsp), and Quasitropical Dry Savanna (TQA) that appear with the real world data. These mostly appear in isolated valleys on the northern Andes, New Guinea, and in central east Africa. The patch in South America appears in all 4 datasets, but the other 2 patches only appear in the ERA5 and Chelsa datasets.
DeleteQuasitropical Forest (TQf) appears in all 4 datasets.
Quasitropical Monsoon Forest (TQfp) appears in all 4 datasets except for the 2070 Terra dataset.
Quasitropical Moist Savanna (TQs) appears in just the ERA5 and Chelsa datasets, found in Peru.
Quasitropical Moist Monsoon Savanna (TQsp) appears in just the ERA5 1991-2020 dataset but not ERA5 1961-1990, is found in central Africa.
Quasitropical Dry Savanna (TQA) appears in only the Chelsa dataset within Peru.
Only the Beck et al dataset has no Quasitropical biomes.
Is this correct that some places are TQ biomes within the present day period?
This comment has been removed by the author.
DeleteOne more thing of note with the Chelsa dataset, is that while it did have predefined PET data available and no predefined AET, is that there are no cool or cold pluvial steppe biomes. I don't know why Cool Pluvial Steppe (CAap) and Cold Pluvial Steppe (CAbp) both do not appear in the 4.6km Chelsa dataset using pre-defined PET data, but both of them come back if I use the estimate PET with kalike 7mm option. Doing so causes Tropical Dry Monsoon Savanna (TUAp) to disappear with switching from pre-defined PET to kalike 7mm PET.
DeleteAs such, from the data available:
*Cold Pluvial Steppe (CAbp) - does not appear in the Chelsa 4.6km dataset using pre-defined PET only.
*Cool Pluvial Steppe (CAap) - does not appear in the Chelsa 4.6km dataset using pre-defined PET only. Also missing from the WorldC 4.6km dataset and the Beck et al 11.1km 1991-2020 dataset.
*Tropical Dry Monsoon Savanna (TUAp) - does not appear in the WorldC 4.6 km dataset, and is missing from all Beck et al 11.1km datasets that I processed (1901-1930, 1961-1990, 1991-2020, and 2070+). Converting ERA5 and Chelsa to kalike will cause this biome to disappear.
There seems to be something with the kalike 7mm toggle that causes Tropical Dry Monsoon Savanna (TUAp) to disappear completely (this is true with ERA5), and occassionally also causes Cool Pluvial Steppe (CAap) to also disappear from time to time.
I'm curious, if someone ran the 930m 43200x21600 native resolution dataset from Chelsa and WorldC inside koppenpasta. Are these Pluvial Steppe and Dry Monsoon Savanna biomes actually non-existant, or just a limitation of downscaled 930m to 4.6km resolution? I can't run the 930m native resolution as it consumes too much space and bandwidth for myself to check whether these 3 biomes exist. So I'm limited to 4.6km 8640x4320 resolution and not the native 930m 43200x21600 resolution for plugging in WorldC and Chelsa data in koppenpasta.
The more I ponder the issue of using kalike 7mm vs. pre-defined PET data to calculate the Mediterranean GrS threshold, the more I'm starting to think the only proper way to calculate Mediterranean biomes in the Pasta system, is to derive the Mediterranean GrS calculation straight from kalike 7mm, and to skip the pre-defined PET/AET data or the more complex algorithms for PET/AET calculation.
DeleteOnce I reviewed the differences between pre-defined PET vs. kalike 7mm PET in the Terra 2070 dataset, I once again realized another issue with the 1.15 GrS threshold when using the 2070 Terra dataset. (Doesn’t apply to the 1961-1990 or 1991-2020 Terra datasets)
If I use pre-defined PET from the 2070 Terra dataset with a GrS of 1.15, all of Queensland in Australia is marked as Mediterranean, which is just horribly wrong. Meanwhile, much of the Pacific Northwest from coastal California to central Cascadia gets marked as “Dry Savanna” and “Moist Steppe", even though they are all still clearly marked as Mediterranean in the Koppen system. If I instead use “kalike 7mm” alongside a Mediterranean GrS of 1.0; and skip the Terra 2070 pre-defined PET data; Mediterranean biomes are calculated correctly. Queensland returns to “Dry Savanna”, the Mediterranean biomes are restricted to southern New South Wales, and the Pacific Northwest has a expansion of Mediterranean & Submediterranean biomes covering the appropriate extent, with a transition to Temperate Rainforest that still seems to be reasonable.
This mostly comes down to classifying Vancouver, British Columbia, Canada consistently in the Pasta system. Getting the Mediterranean PET and GrS calculation wrong results in inconsistent results for the correct Pasta biome classification of Vancouver BC, Canada.
Using pre-defined PET for ERA5 and Chelsa, there is no actual GrS threshold that will satisfy the correct classification of western coastal Italy as Mediterranean, without causing Mediterranean biomes to appear in the completely wrong locations. Any GrS above 1.05 will over-proliferate Mediterranean biomes in the completely wrong locations. Anything below 1.05 will always fail to find pre-existing Mediterranean biomes. The only way to calculate the correct Mediterranean biomes in ERA5 and Chelsa is with the kalike 7mm option. It’s the only way western coastal Italy and the Pacific northwest have the correct Mediterranean biomes. ERA5 has some unwanted “Dry Savanna” in western California if I use pre-defined PET vs. the correct output of “Mediterranean” using kalike 7mm PET.
This comment has been removed by the author.
DeleteThus I’d now suggest that the Pasta biome system be overhauled, such that Mediterranean biomes are derived only from the kalike 7mm toggle concerning temperature and precipitation only. The Mediterranean calculation should always skip PET from pre-defined files or the more complex PET formulas, as they will result in Mediterranean biomes having an unwanted eastward inland shift. As such, if PET is calculated from more complex formulas or from pre-defined files, I’d suggest modifying the formula such that a second calculation of PET and AET take place using only the kalike 7mm formula specifically for calculating Mediterranean biomes, with a GrS threshold of 1.0. Aridity thresholds and Pluvial EvR should always prefer the more complex PET formulas or take PET/AET from pre-defined files.
DeleteIf the kalike 7mm option is used to calculate aridity thresholds and pluvial zones, then there is no need to calculate PET and AET twice for Mediterranean zones, and only a single calculation is necessary to find Ar, EvR, and GrS. Using a more complex PET formula or deriving PET from a pre-existing file is what necessitates a second round of PET/AET calculation using kalike 7mm to calculate the correct Mediterranean biomes.
This is because I sense the same issue across Terra 2070, ERA5, and Chelsa; that all have pre-defined PET data available and as such can be calculated from both pre-defined PET or kalike 7mm PET:
- If I calculate using kalike 7mm with a GrS of 1.0, then the Mediterranean biomes will all be correct, but then the aridity thresholds and pluvial zones will all be wrong in central Africa and India.
- If I instead use pre-defined PET and use a GrS of 1.15 for the Terra 2070 dataset; and a GrS 1.00 or 1.05 for ERA5 and Chelsa; then the Mediterranean biomes will generate incorrectly shifted too far inland eastwards, but the aridity thresholds and pluvial zones will be correct in central Africa and India.
Using average temperature instead of the extremes and the 7 mm/C estimation instead of real PET are really only meant as last-ditch, no-better-option rough proxies, you should always use the latter where it's available, and it's unsurprising that these inexact proxies are getting different results from the better data. With the transition to hot climates, both the 50 C maximum temp threshold and 40 C average temp proxy are pretty inexact given that we don't have much data from Earth to go on, so I'm not too concerned with discrepancies of a couple degrees. With Mediterranean zones, it's not inherently an issue that for 2070 predictions it disagrees with Koppen or implies surprising shifts in climate. We'd probably have to dig into the specific seasonal patterns for each of these problem areas to decide if it really would be reasonable to expect they might have more Mediterranean-like climates, but ultimately either:
DeleteA, these areas really should be classified as predicted
B, there's some oddity with how PET or other data is defined or estimated in these datasets that's skewing the outcomes
or C, the approach of using GrS is just flawed, or at least doesn't extrapolate well to this hotter climate.
There's no case where using less accurate PET data would be the preferable option.
This comment has been removed by the author.
DeleteTo my understanding, for the 3 datasets that have pre-existing PET:
Delete* Terra calculates PET using Penman Monteith
* Chelsa calculates PET also with Penman-Monteith
* ERA5 calculates PET using the Hargreaves 1985 method
I have no idea why when using the Chelsa and ERA5 dataset PET, the Mediterranean biomes won't appear in western Italy, even though it uses the same formula as with Terra. No GrS threshold using the pre-defined PET gives a good match for Mediterranean zones with these 2 sources, and I could only get a good match for Mediterranean zones by switching over to using estimated kalike PET with 1.0 GrS.
I still have the full size Pasta biome map render outputs for the 3 sources. One version uses the kalike 7mm PET, and the other using pre-existing PET (with GrS of 1.00, 1.05, 1.10, and 1.15 for ERA5 and Chelsa). So the map outputs would directly show where the discrepancies appear when they can be compared directly.
As far as I'm aware, looking at precipitation patterns from ERA5 directly, I would expect western coastal Italy and much of the Pacific Northwest (Vancouver/Seattle/Portland) should be solidly Mediterranean. ERA5 data shows a dry-summer, wet winter precip cycle, but the Mediterranean zone is only applied if I estimate PET using the kalike option, or use Koppen Geiger. The same issue with the Pacific Northwest with the 2070 Terra dataset (still dry summer, wet winter with actual precip).
Also, one other sidenote, for calculating Pasta system biomes in the 540 million years dataset, a GrS of 1.0 should generally be sufficient, given no pre-existing PET data to fall back on within in the 540 million years dataset. So it leaves me pretty confident that a Mediterranean GrS threshold of 1.00 with the kalike 7mm PET should align pretty well, as the outputted Mediterranean zones generally match up. The only thing I could note is that the modelled output for the Holocene timepoint has submediterranean biomes (CMa) extending up to southern England, but I am not too surprised given that the 2070 maps from both Terra and Beck et al extend arid Mediterranean zones (CAMa) up to at least Paris, France; and into southern England when using the estimated kalike PET.
Worth noting that GrS isn't calculated from PET directly, it's based on precipitation and evaporation (though PET does affect Ar and GAr and so more directly determines the mediterranean/submediterranean boundary). If changing PET has an effect, it's because you're having to estimate evaporation from PET, which may not be terribly reliable.
DeleteI just tried generating debug files for the ERA5 1991-2020 dataset. It does not save yearly PET if calculated manually, so I don’t know what PET the script is getting.
DeleteFor Rome Italy, I get a GrS of 1.12 if PET is taken from source, but the GrS drops to 0.96 if I switch the kalike estimated PET. The kalike PET calculation allows Rome to be marked as Submediterranean, but is currently Oceanic Forest using data source PET.
While a 1.12 GrS for Rome, Italy may seem fine on paper, that’s because a large portion of Uruguay, central southern Africa, and Queensland also have GrS of 1.05-1.15 if PET is taken from the ERA5 data source. So for ERA5, I have dropped the GrS threshold to 1.00, and increasing it to 1.05 doesn’t re-added the actual Mediterranean zones, and 1.10 GrS adds a bunch of Mediterranean zones in the wrong locations.
St George, Queensland, Australia has a GrS of 1.08 using PET from ERA5, but if PET is calculated within the script instead, I get a higher GrS of 1.10. The GrS is lower than Rome and so would be marked as Mediterranean if I raise the GrS, but not Rome, Italy, if I stick with ERA5 PET data. GrS is higher than Rome only in the kalike toggle.
Ukiah, California has a GrS of 1.10 using ERA5 PET data, but if PET is calculated using kalike, GrS is almost halved to 0.64. Mediterranean only gets applied if I use estimated kalike PET, using ERA5 sourced PET data instead, and it gets marked as a dry Steppe.
One other note, the 48C threshold for the tropical-hot transition using the “tclim” toggle is derived from my testing using ERA5, Terra, and Beck et al datasets. ERA5 already has data on yearly absolute maximums and minimums, in addition to monthly averaged highs, lows, and means; which is where I derived the threshold from.
ReplyDeleteThis is probably an amateur question, but I would like to know how do you envision the more exotic environments (extraseasonal, hot) to be like more elaborately. For example you mention that the plants in the hot group would have to go through special adaptions to the extreme heat, and since those don’t really exists on earth, (maybe in cacti or other succulent plants but even those would be eclipsed or maybe correlated to the aridity adaptions) I’m interested to know what do you think they’ll be like.
Thank you.
While I am an amateur on the subject of plant evolution I have spent some thought on this. Cris Wayan has come up with the idea of a planet having close to 90° axial tilt and still having a full ecosystem. But he has never gotten around to actually describing it. I got so curious I decided to figure it out myself. My version of Lateria (as he has decided to call it) has the following parameters:
Delete¤ An air pressure of 2,67 atm.
¤ An axial tilt of 81°.
¤ A carbon dioxide level of 337 ppm or 0.0009 atm.
¤ A diameter of 10,192 km or 80% of the Earth.
¤ An eccentricity of 0.033 or 98% higher than Earth.
¤ A gravity of 0.94 G.
¤ A solar day of 23 hours.
¤ A temperature of 23°C.
¤ A year length of 368 days.
Like Cris Wayan I assumed rotation period to matter more for precipitation patterns than axial tilt. This means there is an Equatorial Convergence Zone moving considerably with the seasons. Similarly, there are several Subtropical High Pressure Zones and two Polar Fronts. Still, an additional Convergence Zone forms around the summer pole twice a year. The Polar Front of the summer hemisphere is then adjacent to it. At the same time the Polar Front of the winter hemisphere greatly weakens.
The growth of photosynthetic organisms is limited by light, moisture and temperature levels. Most climates on Lateria have combinations of these not occurring on Earth in historical times. I can still make some educated guesses on what type of vegetation would grow where based of these parameters. Lateria has what we would recognise as trees and shrubs as well as semi-shrubs and herbs. Something analogous to grasses covers large areas and will be referred to as “grass”.
I realised that I have contradicted myself about the orbital time of my high axial tilt world. Its orbital time is 368 1/5 local days. Since its rotation time is 23 hours this is slightly less than 353 Earth days. Only areas within 8° of the equator have a day-night cycle all over the year. Areas between 8° and 12° have a short period of midnight sun but no polar night. At lower latitudes polar night happens during the dry season so it does not matter much. It is not until one reaches the areas getting precipitation from the Polar Fronts does it start to matter more.
DeleteClosest to the equator there is a zone of mostly Maritime climate. There are two colder/dryer and two warmer/wetter periods a year. The lowlands are covered in forest were trees and shrubs have stiff, medium-sized leaves. These photosynthesise most of the time but can be folded down if it gets too cold and/or dry. Otherwise, these forests somewhat resemble temperate rainforest. On higher altitudes they sparse out into extensive moorlands due to the shortness of the seasons. Then there is a narrow zone of alpine meadows below the snowline. All young mountain chains within 15° of the equator are heavily glaciated.
DeleteA little further from the equator the climate becomes a little warmer. The two wet seasons merge into a single one. Trees and shrubs shed their leaves during their hemisphere’s winter. There is a band of deciduous forest before the dry season gets severe enough for woods to sparse out into savannah. At the same latitude the moorlands also give way to grasslands on higher altitudes. Eventually trees disappear except for the continents’ east coasts with other areas having cold monsoon steppe.
At 15th parallel lowland temperatures keep above 15°C the very most of the year. The coldest time of the year now coincides with the short polar night. However, frost no longer occurs below a few hundred meters’ altitudes. There is a less severe dip in temperature around the time of midnight sun since it is so low in the sky. The two yearly temperature peaks now commonly reach above 30°C. I have decided to call the period of lower temperature between them “sumter”. This word has been suggested to refer to all times of intermediate temperature.
Most deserts are found between 25th and 35th parallels. These are surrounded by considerable areas covered in thorny shrubs. In equatorward lowlands these are deciduous with deep roots to reach whatever water is available. Virtually all precipitation comes during the warmer half of the year. Polewards and on higher altitudes they are evergreen to grow whenever they can. Lower vegetation in both areas is either succulent or short-lived. These also grow sparsely in the desert among rocks and gravel. Dune seas only have short-lived herbs sprouting after the occasional rain. Same applies to the two large inland areas below sea level. Temperatures there can reach above 50°C at the peaks and below 10°C at the end of the polar night. No perennials on the planet can handle such high temperatures. The salt lakes in the middle of them are so hot they only have microbial life.
The only significant areas of monsoon forest are on the northernmost continent. The warmer type has two temperature peaks a year. These have six to ten months with average temperatures of 25° ‒ 45°C. The cooler type has about 8 months of such temperatures and regular frosts towards the end of the polar night. Nealy all precipitation comes in the form of monsoon rains during the warmer half of the year. Both types of forest are deciduous and lush in the wet season. The difference is the cooler type needing defences against regular frosts. On the other hand it only has one yearly temperature peak. There is also a large area of cold monsoon savanna in the middle of the continent. It is in partial rain-shadow of an older mountain chain. South of this mountain chain there is some moorland above the monsoon forest.
Only on the largest continent does the desert reach 40th parallel. This is due to being in rain-shadow from both the east and west. The planet’s northernmost desert is the only one getting regular frosts too. The sparse vegetation growing there consist of different species than further equatorward for this reason. Regardless of latitude there is an equally wide band of shrubland poleward of the deserts. These consist of the same species as grows on higher altitudes above them. Mountains in dry areas have grass-steppe between the shrubland and alpine meadows.
In the mid-latitudes there are large areas of grassland with pulse-like climate. Precipitation comes mainly during the colder half of the year. While winters are relatively mild they have a considerable period of polar night. Growth mostly happens in spring when light and moisture coincide. Except for the monsoon forest of the northernmost continent trees can only grow along rivers and near the cost. Equatorward the west coasts are somewhat mediterranean. But polar night often limits growth to a longer period in spring and a shorter one in autumn. Trees and shrubs there are evergreens to exploit both periods and possibly thunderstorms in-between. Their leaves are rather small and might be needle-like. Further polewards the coasts have small areas of monsoon forest before the climate gets too cold. These get enough precipitation in summer for deciduous trees to exploit.
DeleteThe climates of the high latitudes could probably be described as Continental and possibly Extracontinental. All areas bellow a few hundred meter’s altitude have temperatures around 40°C in summer and persistent frost in winter. Polar nights grow long enough to limit growth in autumn. The areas with persistent frost furthest from the poles experience pronounced summer drought. Thanks to the Polar Front there is some precipitation year-round. However, evaporation is so high there is still shortage of water in summer. These areas have a sparse cover of evergreen trees with leaves resembling those of conifers. Similar trees grow on higher altitudes a bit closer to the equator too. Towards the poles precipitation in summer increases due to a monsoon effect from the hot summer pole. This allows the same tree species to grow more densely. Still, such forests are only particularly lush at the coasts. There are some moorland and alpine meadows on higher altitudes. Particularly on the south pole continent where the most poleward tree species can’t cope with the winters of the highlands.
The same monsoon effect creates a relatively narrow band of deciduous forests closer to the poles. These have relatively little undergrowth because light is spotty there. Trees growing closest to the north pole have thick, fluffy bark and giant leaves to transpire immensely in summer. The southernmost ones instead keep their dry leaves in winter to let them be covered in snow. Still, their leaves are large and entirely replaced in spring. In both cases heat waves may kill all their samplings in the temporarily hot areas.
Closest to the poles the climate is too extreme for any perennials. Temperatures range from around 50°C at the peak of summer to nearly -30°C in winter. I have decided to call this biome the polar plains. They have one annual plant community growing in spring and another in summer. Autumn gets too dark too quickly to have much in the way of a growth season. Then decomposers take over for a short time before it gets too cold.
Do you have any recommendations for using the Pasta system when manually mapping climate? I'm not exactly sure how to determine things like the GDD or GAr manually, among other things.
ReplyDeleteThere's an edge case I noticed. In an area with periods of low light where the temperature dips just below 10 C, the climate could show as subtropical, oceanic temperate, oceanic boreal, oceanic tundra, or cold barren depending on the amount of light. The latter 3 would more resemble quasitropical or tropical dark than how these zones are usually perceived, at least to my understanding.
ReplyDeleteThat's true but I'm not sure what a better solution would look like, either I'd have to fuss with the temperature boundaries so that different levels of light had different tropical/cold boundaries, or I'd have to add in a lot of extra zones for dim, cool climates. Ultimately, compared to Koppen, I decided to focus a lot less on the general "feel" of a regions climate and more on the parameters I thought might have the most impact on vegetation cover.
DeleteHow would you classify low light and dark climates with cold, hot, or extraseasonal thermal characteristics? Additionally, how would life respond to a "mediterranean" quasitropical (i.e. precipitation mostly occurs in the dark period)?
DeleteFor most categories, both temperature and light levels are accounted for when counting up growing season parameters (GDD etc.) and then that single resulting count is used to classify into marginal and barren zones regardless of whether it's mostly due to thermal or light factors, the idea being that they'll probably have similar responses to either restriction on growth.
DeleteI would imagine that a med-like precipitation pattern for quasitropical could give you something more shrublandy like hot meditteranean regions on Earth. Really we could have a whole other full category for light-restricted thermally tropical regions, but I didn't want to add a whole other set of zones for what'll probably be a generally somewhat niche case.
I was going through the boreal-temperate transition zone using the 1901-1930 global dataset, and the boreal-temperate transition would most likely be better positioned at 1200 GDD rather than 1300 GDD, since at 1300 GDD places like northwestern Maine get marked as "boreal" and the boundry is too far to the south even compared to koppen geiger for the same time period
ReplyDeleteSo I grabbed the maximum GDD values in the "percontinental boreal" zone for every single historical dataset I could send into the generated map output; and I found that 1225 and 1160 give much better fits than a GDD of 1200. A boreal-temperate GDD cutoff of 1225 gives usability for most historical datasets prior to 1990. A GDD of 1160 is the best fit GDD threshold for the earliest datasets prior to 1930.
DeleteWhat variable from exoplasim's output is used for light-limited GDD?
ReplyDeleteI took rss (surface net shortwave flux, i.e. the light absorbed rather than reflected by the surface) and subtracted ssru (surface solar radiation upward). In Exoplasim's simple radiation scheme, "shortwave" and "solar radiation" are the same, and radiation is always counted as positive downwards and negative upwards; so ssru is a negative value for sunlight reflected off the surface, so subtracting it from rss essentially adds back the reflected light and gives you the direct light exposure of the surface.
DeleteQuick question: do the "average temperature" columns in your charts represent data for (A) average temperature across the entire coldest month and hottest month, or (B) average daily low temperature in the coldest month and average daily high temperature in the hottest month?
ReplyDeleteThey're overall monthly averages, the idea is you could use them in any case where you don't have any data on daily temperature variation. If you do have monthly averages of daily lows and highs that's probably a good way to define MinT and MaxT, but different sources can vary a lot on what sort of data like that they provide.
Delete