Climate Explorations: Temperature
 |
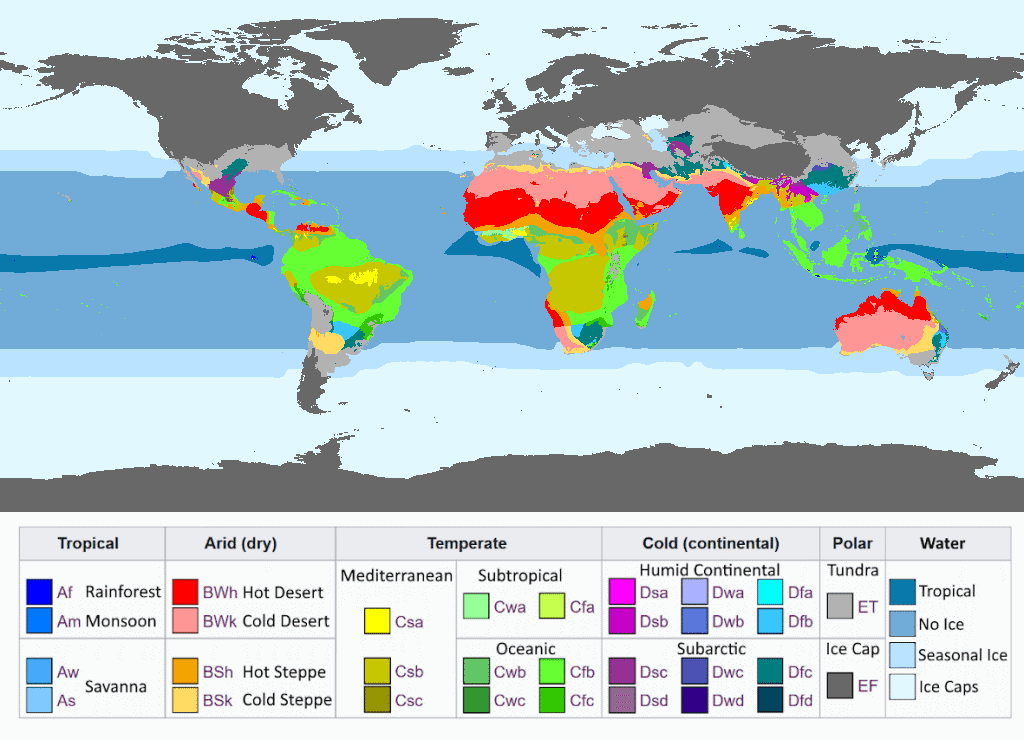
| "True color" approximation for Earth modeled at an average of -10 °C. |
This is the first in a series of shorter posts I’ll be doing where I take the ExoPlaSim climate model (which I described here) and use it to explore a broad number of interesting climate scenarios using the same standard topography. Eventually I hope to explore most of the climate forcings I discussed in Part VIa. In this case, I'll be looking at models of climates at a range of different average temperatures, from those teetering at the edge of a snowball (and a quick look at the snowball climate itself) to those approaching a moist greenhouse.
First off, here’s my standard methodology: I’ve started by running a model at T42 resolution (64 by 128 cells) with parameters matching pre-industrial Earth, though simplified in a few places to work as a cleaner starting point:
- flux = 1367
- startemp = 5780
- year = 360
- eccentricity = 0.0
- rotationperiod = 1.0
- obliquity = 23.5
- fixedorbit = True
- pN2 = 0.78
- pO2 = 0.21
- pAr = 0.01
- ozone = True
- wetsoil = True
- vegetation = 2
- initgrowth = 0.5
- glaciers = {'toggle': True, 'mindepth': 2, 'initialh': -1}
- physicsfilter = 'gp|exp|sp'
Here’s the heightmap I used for topography—note that, for largely practical reasons, I won’t be adjusting sea level or the topography of glacial regions (Antarctica and Greenland) to account for ice melt or formation:

At this resolution, the maximum elevation is roughly 6300 meters (I’ve also clipped the lowest land elevation to be at least 25 meters, which ensures a proper land/sea distinction with the 8-bit colors used here).
I’ll be using this model as my baseline for most of these simulations; spinning it up again, altering the parameters I want to experiment with, and then running again to balance. The results may not be quite as accurate as if I ran each model anew, but this approach saves a lot of simulation time. There are some cases where multiple models fall into a logical sequence and so I’ve run them in order (e.g. in this post, the baseline model was used as the starting point for the 10 °C model, and then the final year of the 10 °C model was used as the start for the 5 °C model, and so on). There will also be some cases (e.g. 90° obliquity) where the climate state is so distinct from modern Earth that I have spun up a new model from scratch.
For the most part (this post being an obvious exception) I want to explore worlds with a similar overall range of temperatures to modern Earth, but many of the parameters we’ll explore have some impact on global average temperatures. As such, I’ll first run them to balance with just the experimental parameter changed, but then I’ll alter other parameters to attempt to bring the global average surface temperature back into the range of 14 to 16 °C. I’ll achieve this mostly by altering the CO2 level, but if it drops as low as 10 ppm CO2 (roughly the minimum CO2 level required for carbon-fixing photosynthesis) then I’ll leave it there and start decreasing flux of sunlight instead if further cooling is required (year length will not be altered to simulate a wider orbit; chalk it up to variances in stellar luminosity). Where multiple models are run in sequence, I’ll just retain these changes from one model to the next (e.g. if I have to lower CO2 levels for the 30° obliquity model, I’ll keep that CO2 level when starting the 45° model).
For each model, I’ll indicate the previous model used as the starting point, the final average temperature (based on the 2-meter air temperature data, as that’s close to 15 °C for our baseline model), and the CO2 level (and, where appropriate, sunlight flux) used to achieve balance.
Once a model has finally run to balance at an acceptable temperature, I’ll run it an extra 10 years to give use a good data sample for producing Koppen climate maps. I’ll do at least 2 for every model: One at the model resolution (upscaled to 512 by 1024 pixels just so it displays properly) and one interpolated up to 512 by 1024 resolution, using “dummy” sea ice and adjusting temperature by the topography in the above heightmap. I may also add other maps made in Panoply of various climate conditions (also averaged over 10 years using the eps_avg.py script I recently added to the koppenpasta repository) where appropriate.
The code to achieve all this is a bit complex, so I've put together a separate post reviewing it for those who want to do something similar.
So let’s get started.
Baseline (15 °C)

Prior Model: None.
CO2 Level: 300 ppm
Average Temperature: 15.5 °C
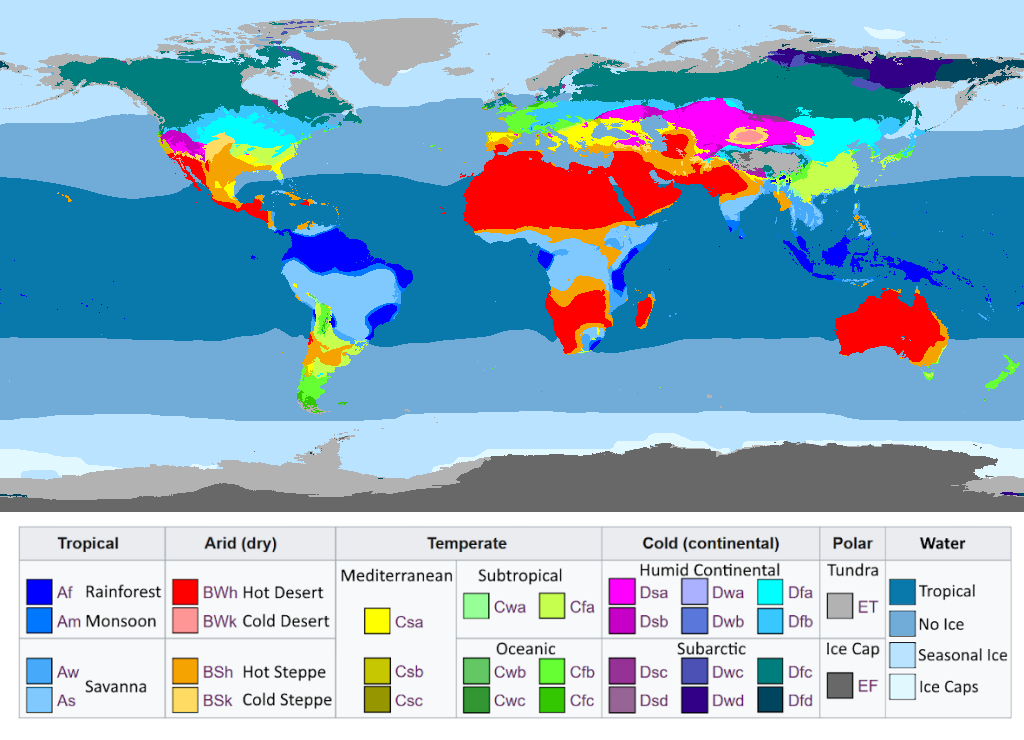
This is ExoPlaSim’s best attempt to model modern Earth. There are, of course, a few differences with Earth’s actual climate:
 |
| Beck et al. 2018 |
I already went over some of these issues in the ExoPlaSim tutorial, but in short: the ice caps are too small (though they might be larger had I started with a colder model and warmed it to this point, emulating Earth’s recent warming from an ice age), a lack of deep ocean currents leaves some areas like northern Europe too cold, the East Asian monsoon is too weak, mountains aren’t quite cold enough, and a few areas are a tad too arid. Bear all that in mind when interpreting the rest of the models in this series.
Let’s look at the key elements of climate a bit more closely:
 |
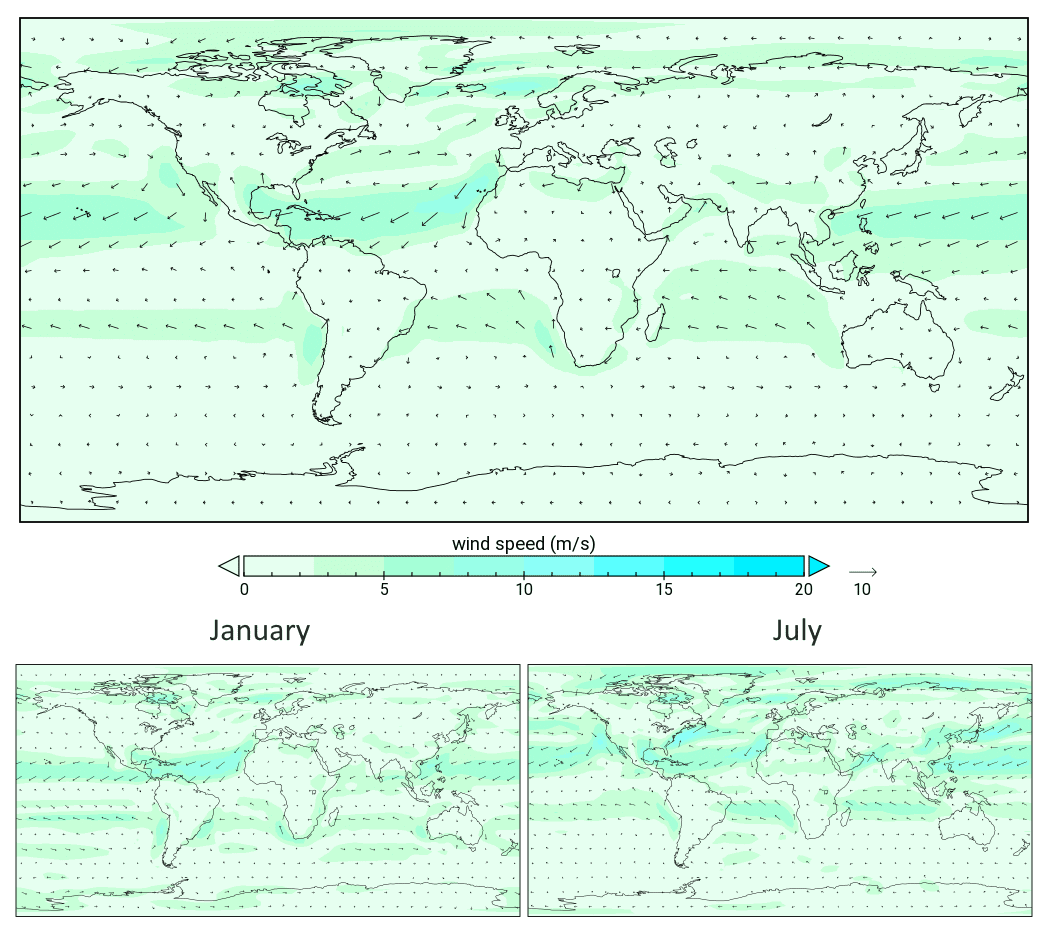
| Average on top, January bottom left, July bottom right, all on the same scale. Contours on the maps correspond to the major "ticks" on the scale. |
Temperature generally remains in the range of -40 to 40 °C, with some deserts reaching over 55 °C at midday in summer and Antarctica plunging to under -80 °C in winter.
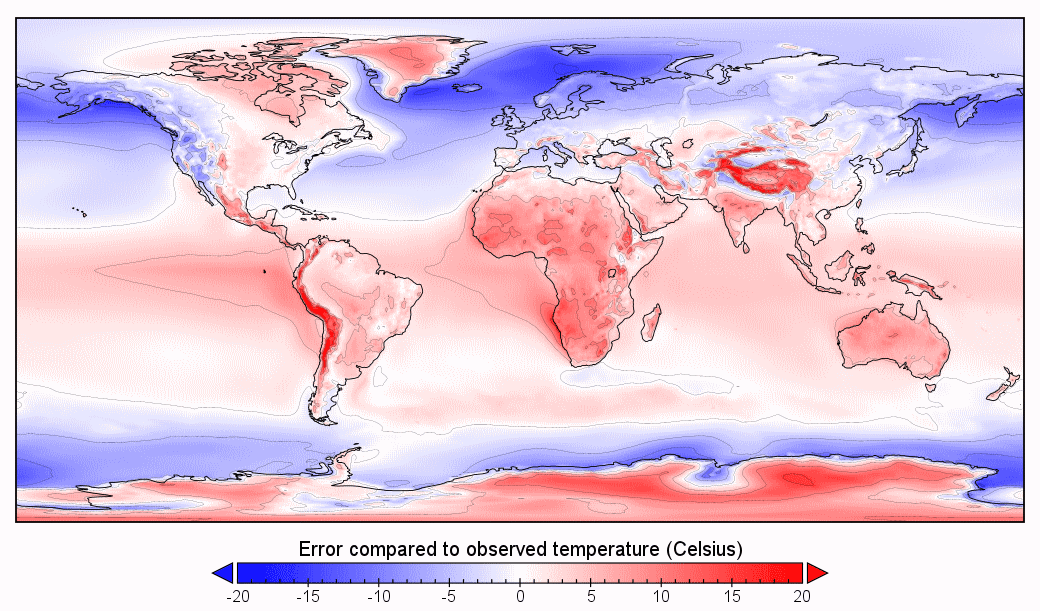
Compared to real climate data from Earth (from here) this is generally the right range of temperatures, but there are some systemic errors, attributable mostly to the lack of deep ocean currents: tropical landmasses tend to be 5-10 °C too warm, west-facing coastlines at high latitudes are similarly too cold. Highlands are generally modeled too hot but that's mostly down to the low resolution, and polar landmasses that should be glaciated are of course too warm.

Annual mean precipitation averages around 110 cm/year, reaching up to over 500 cm/year in equatorial rainforests and down to under 5 mm/year in the central Sahara.
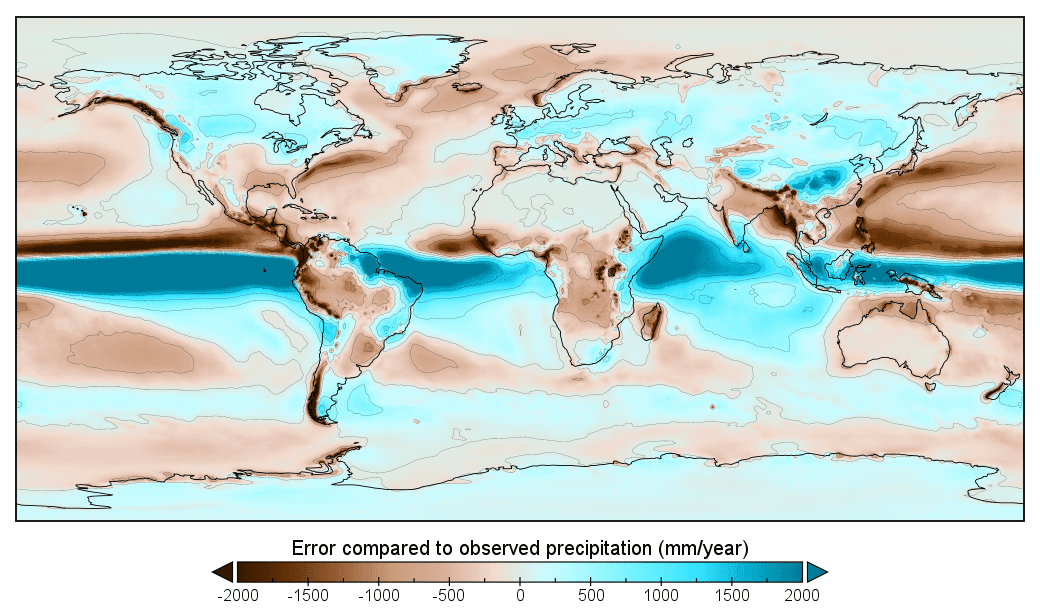
Compared to Earth, this is about 10 cm/year too wet on average. The average position of the ITCZ is a bit south of where it should be in reality, with monsoon effects being generally too weak. Continent interiors are generally a tad too dry at low latitudes and a tad too wet at high latitudes. Combined with the discussed temperature errors, this makes the tropics a bit too arid overall.

Wind speed averaged about 6 m/s globally, up to 14 m/s in the Southern Ocean in winter.

ExoPlaSim’s rather simple vegetation model does a decent enough job of reflecting the overall distribution of major forests, save for the oddities in east Africa.
Hot Worlds
20 °C


Prior Model: Baseline.
CO2 Level: 550 ppm
Average Temperature: 19.8 °C
This is a cool greenhouse state, last reached in the late Eocene around 40 million years ago, and roughly the average climate for the last half-billion years. Earth may return to something like this after a couple centuries of continued climate change.

For the most part, the changes are subtle; The major climate bands have all shifted poleward, with continental climates extending into the polar landmasses, Greenland and Antarctica. There are no more permanent sea ice shelves save for a few coastal patches. The southern ice cap survives here largely because the model has been warmed from a cooler state (and I haven't lowered the elevation from the surface of the current ice cap); an initially warmer world cooled to this temperature may lack ice caps or feature far smaller ones.

Relative warming from the baseline is mostly concentrated towards the poles, up to 11 °C in some areas, while the tropics have only warmed by a few degrees—though the Sahara can now reach over 60 °C at midday in summer.
25 °C


Prior Model: 20 °C
CO2 Level: 1060 ppm
Average Temperature: 24.6 °C
This is a warm greenhouse state, last achieved during the Paleocene-Eocene Thermal Maximum, 56 million years ago.

This is a more substantially different climate: the ice caps have disappeared completely and the polar landmasses are now vast boreal forests, with some temperate coastal regions.

On the other continents winter snow and frost are largely restricted to the deep interiors. Sea ice is rare.

This warmer climate is also wetter, with moderately smaller deserts compared to baseline and global average precipitation increased by around 25 cm/year.
30 °C


Prior Model: 25 °C
CO2 Level: 1980 ppm
Average Temperature: 29.6 °C
This represents an extreme hothouse state; within the last half-billion years, such temperatures may have been achieved only briefly at the end of the Permian, 251 million years ago.

Much the same trends we’ve been seeing continue here: temperate regions have expanded over much of the high latitudes, and vast rainforests dominate the tropics. Much of the tropics rarely drop below 30 °C, and the deserts can reach over 70 °C in summer.

The overall climate is, again, wetter (by 40 cm/year on average), but there’s also a notable poleward shift in the desert belts, corresponding to a slight widening of the Hadley cell.

40 °C


Prior Model: 30 °C
CO2 Level: 0.022 bar
Average Temperature: 39.5 °C
Earth has likely never gotten this hot within at least the last billion years at least, and in general it’s likely that carbon-silicate cycling would prevent such a temperature being achieved under any normal circumstances. But a planet experiencing extreme volcanism, on its way to a moist greenhouse, or experiencing some other kind of strong climate forcings might conceivably have a climate this warm.
Note that, at this point we shouldn't put too much trust in the stated CO2 level; ExoPlaSim is probably underestimating greenhouse heating when they get this high. Fortunately that shouldn't affect the rest of the modeled climate too much.

This world is perhaps beginning to resemble the sci-fi “jungle planet” trope; tropical and subtropical rainforests dominate most of the continents. Still, some of the deserts have expanded as they continue to shift poleward.

50 °C


Prior Model: 40 °
CO2 Level: 0.18 bar
Average Temperature: 49.6 °C
We are perhaps pushing the model past the point of reason here; there is now almost as much CO2 as oxygen in the atmosphere. Tropical rainforests dominate, but vast deserts now occupy the interiors of some continents.
 |
| Note that I shifted the color scale. |
Snow does still fall in Antarctica in winter, though it never accumulates.
60 °C


Prior Model: 50 °C
CO2 Level: 0.65 bar
Average Temperature: 59.6 °C
This is close to the maximum temperature that could be achieved before a moist greenhouse state occurs and the planet loses most of its water to space. Even Antarctica rarely drops below 20 °C in winter, and some deserts can surpass 100 °C in summer.

Both the Koppen zones and ExoPlaSim’s vegetation model predict vast, thick forests, but frankly I’m not sure how reliable either model is at such extremes; plant life on Earth likely couldn’t tolerate such high temperatures, but alien life may of course find ways to adapt.

The trend with precipitation continues, with a global average of around 200 cm/year and some areas averaging over 20 m/year. Even the driest regions exceed 8 cm/year, but the extreme heat and evaporation maintains vast deserts.
The Hadley cells have continued to subtly expand, and extratropical winds have become much more sedate, averaging below 1 m/s in many areas.
Cold Worlds
10 °C

 |
| In all these cooler models the interpolated maps had some erroneous patches of ice-free water near the poles (in waterways too small to appear in the model) which I've removed in an image editor. |
Prior Model: Baseline
CO2 Level: 195 ppm
Average Temperature: 10.3 °C
This is about the temperature during the Last Glacial Maximum, 20,000 years ago. As you can see, the modeled extent of the ice caps is still far short of their actual extent during the ice ages.
 |
| Hannes Grobe, Wikimedia |
In this and the following models, we can expect that any actual such climate would likely have glaciers over much of the areas marked as tundra here, perhaps even beyond.

Still, we can draw some conclusions from the general trends. Much as with warming, cooling here is concentrated towards the poles, equatorial temperatures barely affected. Thus, vast temperate regions in Europe and North America have disappeared, while the tropical band has only slightly shrunk.

Many of the temperate areas that do remain are also notably drier.

5 °C


Prior Model: 10 °C
CO2 Level: 130 ppm
Average Temperature: 5.3 °C
Temperatures this low have likely not been achieved since the Cryogenian, 635 million years ago.

The shrinking of the tropical band is a bit more substantial here, and much of the high-latitude landmasses are nigh uninhabitable (and would likely be covered in much larger glaciers). The Black Sea and Adriatic freeze over in winter. In the growing ice caps, temperatures can plunge to below -100 °C in winter.

The deserts are also clearly shifting equatorward, matching their poleward shift in the warmer models. Global average precipitation is about 20 cm/year lower than baseline. Rainforests have almost disappeared from central Africa for lack of consistent rain, replaced by savanna.
0 °C


Prior Model: 5 °C
CO2 Level: 81 ppm
Average Temperature: 0.3 °C
This is perhaps lower than we would usually expect planets stabilized by the carbon-silicate cycle to reach under normal circumstances, but it might be realistic for a planet on its way to a snowball or with very low rates of volcanism.

The tropical zones have shrunk further, and large semi-arid and mediterranean regions have appeared around their edges. It’s worth stressing, though, that even in such a globally cold climate, there are still large rainforests in the tropics, and the desert regions can still reach up to 40 °C at midday in summer. It is a cooler, drier world, but still one with a broad range of local climates.
-10 °C

Prior Model: 0 °C
CO2 Level: 49 ppm
Average Temperature: -10.2 °C
It seems that ExoPlaSim’s glacial model is finally starting to catch up with the declining temperatures: everywhere outside the former tropics is overrun by ice. Note how stark the transition from ice cap and sea ice to the more temperate climates is: with the more direct sunlight at lower latitudes, the strong contrast in albedo creates a steep temperature gradient.

Meanwhile, tropical climates have near-totally disappeared. Daytime temperatures at the equator can still sometimes reach 30 °C, but the average remains below 20 °C year-round.
-18 °C


Prior Model: -10 °C
CO2 Level: 40 ppm
Average Temperature: -18.0 °C
This is about the minimum stable climate possible without plunging into a complete snowball. Indeed, I’m not even sure that this climate would be realistically stable: a drop by just a couple ppm in CO2 levels will precipitate a snowball state, and Milankovitch cycles could probably have a similar impact.

This is a properly cold world with no warm climates. The warmest parts of the tropics are a mere 16 °C on average. Days can still reach 30 °C in summer in some areas, but nights then often plunge to below 10 °C. The ice caps, meanwhile, can plunge to below -140 °C in winter, and some areas rarely exceed -40 °C.

And, of course, it’s drier as well: Global precipitation averages 50 cm/year, and a fairly thin and immobile ITCZ leaves much of the tropics parched for part of the year.

Life clings to a narrow equatorial strip: Even moderate highlands in the tropics are chilly tundra, and in the lowlands only scattered forests survive between plains of grass and shrub.

-60 °C
 |
| What did you expect, really? |
Prior Model: -18 °C
CO2 Level: 35 ppm
Average Temperature: -59.6 °C
The snowball. As you can see, it only took a slight drop in CO2 to cause the tropics to completely freeze over, at which point the temperature precipitously dropped to these lows within just decades. Whether or not this is actually a reasonable scenario for snowball onset or the Earth ever got quite this cold in the Cryogenian is beyond the purview of this model, but climate models do generally agree that there is a critical threshold latitude well away from the equator that glaciers cannot reach without precipitating a total freezing over of the tropics.

Temperatures generally stay below -30 °C in summer, and can plunge to below -160 °C in polar winters.

Global snowfall averages just 6 mm/year.

Thanks to the homogeneity and low thermal inertia of the surface, the ITCZ can move fairly far with the seasons such that there is essentially one Hadley cell that switches direction with the seasons. Extratropical winds are fairly sedate.
I did some experimentation with recovery from this snowball as well: even up to CO2 levels as high as 0.8 bar, temperatures remained below freezing year-round; at around 1 bar, the ice melts away within decades and temperatures shoot up past 60 °C. I won’t explore this process in detail here, as there are a number of feedbacks not accounted for here (buildup of dust on the ice lowering its albedo and so triggering melting sooner, immediate draw-down of CO2 once melting begins) that would make any actual such transition far gentler, but it does conform to research suggesting that recovery from a snowball should usually result in total loss of the ice caps.
That completes our tour of Earth at different temperatures. Models are already running for our next climate exploration, regarding Earth with a range of different obliquities.
Buy me a cup of tea (on Patreon)
Next Exploration: Obliquity


This is awesome! What attribute are you covering next?
ReplyDeleteObliquity (aka axial tilt) is next, from 0 all the way up to 90 degrees
DeleteVery cool. Using the earth as a baseline really helps visualize the effects of the simulations.
ReplyDeleteGreat post. However, I'm confused as to how you're setting the baseline temperature as I don't see an option for that in the tool. Is this some sort of added functionality from a script? Thanks.
ReplyDeleteI built the scripts to iteratively adjust the CO2 to achieve a desired temperature, though I ended up having to stop it and directly set the CO2 level to make the -18 C model work. You can see an early version of this at the end of the main tutorial https://worldbuildingpasta.blogspot.com/2021/11/an-apple-pie-from-scratch-part-vi.html#scripttemplates and I'll make another post in not too long going over the more refined version I used here.
DeleteDoes the change in temperature affect the latitudes where monsoon circulation takes place? Where would it happen in the 25 degree model?
ReplyDeleteThere's not really a specific latitudinal limit for monsoon circulation, the movement of the itcz depends strongly on the exact geography and the effect propagates out to basically the whole hemisphere's circulation to some extent. At a glance it doesn't look like the movement of the itcz changes much between the baseline and 25 c models here, but at this resolution exoplasim isnt great at replicating the east asian monsoon
DeleteI am a bit confused about the CO2 level. It goes from 1980 ppm to 0.022 bar between sims. But 1980 ppm is only 0.002 bar and then it's 0.022 - you're making a 10 fold jump here. You need to increase CO2 tenfold just to go from 30 to 40 degrees C, am I understanding this right?
ReplyDeleteYes, there's a general trend of diminishing returns from ever greater concentrations of CO2, or any other greenhouse gas. Think of it like adding layers of tinted glass to a window; the first pane will substantially reduce the light passing through, the next pane will block some more light but not have as much effect as the first pane, and so on with each additional pane. Greenhouse gasses cause heating by blocking infrared light from the surface, so they work in much the same way; the more CO2 there already is in the atmosphere, the less effect any more CO2 can have.
DeleteExoplasim does have some tendency to overstate this trend when you get to very high CO2 values, but apparently it only becomes a real issue when you get to about 0.1 bar CO2 (so the 50 and 60 C models are probably showing too-high CO2 values compared to what would actually be necessary).
Your -10°C is similar to the fictitious world of Gaardinn I made up in 2005:
ReplyDeletehttps://www.ifraagasaetterskan.se/Gårdinn-/-Gaardinn
I made the map of Gaardinn entirely by hand while on vacation in France (Normandy and Brittany). My only guide was a print-out GIF showing the Earth’s coasts and a coordinate grid. Back then I did not know about circulation cells. I naively assumed one could just take to vegetation zones of ice age Europe and place them closer to the equator. Unfortunately, this meant I din not know what to do with the equatorial areas. So I placed the continents on the latitudes where they would be partially glaciated. My idea was to have a cold planet which would not risk freezing over. Something I thought worlds already more than half ice-covered would.
DeleteHi, I've been reading a lot of your blog lately and I have to say that your work is absolutely incredible. The reason that made me research these exoplanetary climate models is that I wanted to try to simulate what the climates of planets in our solar system would be like after being terraformed, especially Venus. And, after reading your explorations of day length, obliquity and temperature, how do you think the climate of Venus could be if you just put an atmosphere and ocean on it? continuing with absurdly long days, 2600W/m^2 of solar irradiance and 0 degrees of tilt, as the high temperatures and obquidity would make it a tropical rainforest/desert planet, but the long days could bring much more mildness to the planet's climate. what do you think?
ReplyDeleteThis is something that has been modelled before here https://arxiv.org/abs/2003.05704 ; it doesn't give much details on the present day case aside from average temperatures of 16 - 60 C depending on the ocean cover, but the results are publicly available and this will probably be the subject of my next public data exploration post
DeleteI had this very thing commissioned at 60% ocean coverage. ExoPlaSim crashes after 20 years using modern Venusian flux. But at solar flux adjusted to allow habitable temperatures, most of the planet becomes a patchwork of ‘subtropical dry night’ climates, Manchurian climates and tropical monsoon climates. Polar regions become temperature deserts. Daytime highs reach 40°C and night lows -20°C in some interior places.
Delete*temperate desert
DeleteHello! I have a question: how will the climate be affected by the opening of mid-ocean ridges (MORs) when sea levels drop significantly?
ReplyDeleteAfter watching xkcd's video "what if you drained the oceans?" I wondered what the climate would be like on the planet.
Since most of the planet would be desert, I roughly calculated the Albedo and entered it into an average planet temperature calculator and the result was about 0°C.
When drained, all the ridges would be open to the atmosphere and the water pressure holding them back would disappear. The paper "Variations in mid-ocean ridge CO2 emissions driven by glacial cycles" by Jonathan M.A. Burley says that a 100 m drop in sea level increased carbon emissions by MORs by 8%. The ridges currently emit 25 MtC/year. So if they were fully opened, they could double the carbon output. But they would also start releasing ash into the atmosphere.
So I don't understand what the overall effect of their exposure will be on the climate. In a situation where, without taking them into account, the average temperature is around 0°C, their influence can either return the temperature to our current level or finally cool the planet to the state of snowball Earth.
So, when you go outside the range of past sea level variation recorded in the geological record, there's a lot we just don't know about the relationship between ocean depth and the nature of seafloor volcanism and the function of plate tectonics more generally, so there's not really any definitive answers I could give you here and you can't necessarily just extrapolate from the effects we see with a relatively minor shift in sea levels. But at any rate some other considerations are:
Delete1, CO2 emission by volcanoes tends to have more enduring effects than ash release, which rarely causes more than a few years of cooling. The sort of mafic volcanism you'd get from an MOR wouldn't produce many large, ash-producing eruptions anyway.
2, shifts in global albedo will be compensated for to some extent by the carbonate-silicate cycle, so I wouldn't put too much stock in that 0 C estimate, but that comes with its whole own can of worms because a drastically different sea level will affect not only volcanism--again in unknown ways--but also global weathering patterns, so hard to say how it all balances out. But so long as there's still a substantial part of the surface that still experiences regular rain, I'm inclined to imagine average temperatures wouldn't be drastically different.
One of these days I'll do an exploration with varying global ocean cover area, but I won't really be able to account for all of this exactly so I'll just go with my usual approach of always balancing to 15 C average (as per usual the individual random variation between planets will probably be larger than the average effect anyway, i.e. dry planets may be colder on average but that doesn't mean there would be no hot dry planets), but it'd be interesting to see how temperature variation and precipitation patterns pan out anyway.
Thanks for the answer!
DeleteIf a CO2 decrease of 105 ppm is needed to reduce temperature by 5 C, how much does stellar flux need to decrease for an equivalent effect (from baseline)?
ReplyDeleteHard to say without running another full model, but based on comparison to rougher models it may be as little as a 1% decrease, though that's assuming no response from long-term carbon-silicate cycling.
DeleteOk! The assumption in the previous comment is that in the latter case, CO2 levels are held constant. So carbon-silicate cycling is ignored.
DeleteHello! I asked a question about low sea level quite a while ago, now I have other questions on the same topic.
ReplyDeleteIf water goes through the Mariana Trench, then the world ocean eventually will be divided into unconnected seas, which will have different altitudes.
1. What will be considered "sea level" - normal atmospheric parameters?
2. What will be the conditions in the areas below this "sea level" of atmosphere?
3. How will air circulation occur between these areas of different altitudes?
4. How will the climate on land behave with such differences in water levels in different regions?
5. More than 3/4 of all active volcanoes are underwater. Does the water trap CO2, or does it escape into the atmosphere at relatively rapid rates?
The ash from these volcanoes does not reach the atmosphere now, I think. If CO2 reaches the atmosphere, but the ash does not, then when they open up to the atmosphere, I think a relative climate shift towards cooling should occur. This will not be a permanent effect, but cataclysms such as "a year without a summer" will happen dozens of times more often.
"Mariana Trench Drain" Scenario:
Water continuously pours out through the deepest point of the Pacific ocean, the seas and oceans decrease until the bottom relief separates them from the drain point.
My thoughts on "sea level". The volume of lost water will be filled by the atmosphere with the same volume. Having found the water loss, you can calculate the required volume of the atmosphere. You can also average the remaining water levels, and get the 0 level of the atmosphere. I want to know your thoughts - am I right or did I miss something?
I made rough calculations, it turned out to be a little more than 2 km deep.
Does this mean that at a level 2 km below our current one, the atmospheric conditions will be like ours at sea level now?
And in areas below 2 km, the atmosphere will be denser, warmer and more humid, right? The region of the former North Pacific Ocean is of interest in this regard - tropical plains below zero altitude by 1-2 km, surrounded by small seas.
I have no idea how to deal with atmospheric circulation of different altitude level zones.
DeleteAnyway, for 2-4, where you decide sea level should be again doesn't much matter, but in terms of relative conditions between basins, yeah lower areas should be hotter, though probably not more humid, air tends to dry out as it descends in altitude, but this may be counterbalanced by evaporation of any bodies of water inside a particular basin. This doesn't necessarily imply that the whole world becomes hotter as the water level drops, because as the atmosphere moves down into the evacuated oceans, the former continents will cool, and the global climate will reach some new temperature equilibrium. But with such large variation in surface elevation, you may get some intensely hot deep basins, and in general less ocean area and a drier climate will encourage greater temperature variations with days, seasons, and between the equator and poles. (Also the current highlands will get even colder, and one more wrinkle on that question of water moving between basins is that some will also fall as snow on these highlands and may become trapped in large glaciers.) As a whole I don't know that anything super weird happens in terms of air circulation between basins, Earth already has some fairly large lakes at high altitude, the most interesting thing is probably just those temperature differences.
5, CO2 from undersea volcanoes does become dissolved in water I think, but the oceans and atmosphere exchange CO2 and are in equilibrium, so the CO2 works its way into the atmosphere eventually; so I don't think exposing these volcanoes changes the equation there much, it's more about how global weathering patterns change (which also takes ages to play out). These also aren't the sort of volcanoes that produce much ash, they're more prone to small eruptions and lava flows like hotspot and rift volcanoes. Ashy eruptions are also driven by water and other volatiles in magma, so may decline if the world as a whole becomes drier and subduction may be interrupted, but that probably takes millions of years to manifest. Conversely a drier atmosphere may have some impact on how long ash takes to settle out but I don't really know how much.
I had to split that reply in 2, make sure you find both of them here
Delete1, wherever you like essentially, sea level is just a convenient reference point and not really a fundamental property of the atmosphere. I agree with your intuition that as the oceans drained away, the atmosphere would move down into the unoccupied volume, such that atmospheric pressure at current sea level would decrease. Exactly what the new altitude-pressure profile would end up being is a tricky question but starting with working out roughly the volume of water lost it probably at least a good place to start. You would end up with some altitude in the new atmosphere that had 1 atm pressure, that of our current sea level, and this should be fairly consistent across different basins, but there wouldn't be anything special happening at that altitude, and it wouldn't necessarily be near the water level in any particular basin. In short, different disconnected basins could have different water levels with different atmospheric pressures at those water levels, and there's no particular reason to choose any one of them as definitive "sea level".
ReplyDeleteWhile we're at it, though, worth noting that the water level in this basins isn't necessarily a straightforward consequence of drainage on the surface, at least in the long run. Water will evaporate off these surfaces and then may move and rain down in another basin, so you can still have water moving between basins, perhaps unevenly; some basins may thus fill up and overflow into their neighbors, while others will dry up. Trying to chart out exactly where all the water ends up would be a somewhat laborious process of modelling the climate of this drained world, finding imbalances in total precipitation and evaporation, and trying to shift water levels accordingly. But this might take a long time to sort out after levels dropped, thousands of years perhaps; but if water is continuing to drain out the marianas trench, then precipitation may continue to bring water in to be lost, so the planet will still be losing water; so long as there's major bodies of water elsewhere, you will probably still get some precipitation into the trench, which means the entire planet would eventually dry out, but this could be an even slower process, and you may have distant surviving patches of water surviving a long time, much as Venus and Mars have been losing water to space for billions of years but still have a bit of moisture in their atmospheres.
Cris Wayan once tried to make such a world without any climate simulation. The premise is aliens stealing 90% of the Earth’s water. 90,000 years later most of the oceans have been lowered by 4 kilometres. The Pacific Ocean is lowered by as much as 5 kilometres. One atmosphere of air pressure is now 1.8 kilometres further down. All the world’s highlands have developed glaciers. In the Artic the glaciers spread out over the lowlands and into the continental shelves. The Antarctic ice sheet has flowed out to cover nearly all of the Antarctic continental shelf. However, most of the world’s lowlands and continental shelves are still inhabitable to humans. Same applies to the upper part of Bengal Fan but the lower part is too hot. At higher latitudes the dried-up parts of the deeper ocean floors have human-inhabitable temperatures. However, the thicker air down there might be unhealthy in the longer run.
DeleteCan Milankovich cycles shift the map from what you shown here in -10 to what you shown in -18?
ReplyDeleteAnd why your +25 model shows some tundra while actual map from proper articles for cretaceous termal maximum and early triassic and even maps from your own posts about different phanerozoic climates generally show no tundra at all? What can explain this difference?
The difference in forcings between the -10 and -18 cases is very small, so yes you could probably expect pretty easy shifting between them, but -18 is also teetering on the edge of snowballing, so if you did have that sort of variability, chances are you'd tip into snowballing at some point.
DeleteThe tundra in the hotter cases is probably because of some combination of A, exoplasim doesn't properly model ocean currents such that it's probably underestimating equator-pole heat transport, and B, the elevation map I'm using is measured from the top of the ice in Antarctica and Greenland, so essentially treating them as high plateaus.
Thank you for the answers. I will now give you a suggestion for 1 of future posts. You made several posts where you played a model of Earth in exosim with only 1 of several variables (temperature, obliquity, eccentricity, day length). What I suggest you to do is combine all these parameters in different values in combinations and produce many many alternative Earth maps with interesting results.
DeleteHow Milankovitch cycles affect climate in hot house when there is a lot of CO2 in atmosphere and poles are covered by boreal forests? Is there similar fluctuation between slightly hotter summers and slightly colder summers and winters, and therfore a little bit warmer or colder Earth in general, as during ice house or during hot house Milankovitch cycles barely affect climate at all?
DeleteCombining different climate parameters is something I'll probably get around to, but I think it's important to understand how each parameter affects climate on its own before we confuse matters too much by combining them, and there's still a fair few individual parameters to get through; though my next exploration will actually be on obliquity and eccentricity combinations, because I couldn't resist seeing what sort of odd seasonal patterns that would produce.
DeleteIn a hothouse climate, milankovitch cycles would indeed have less impact without any amplification by ice-albedo effects, but they would still do something; polar regions might still vary some in their average temperature and seasonality, and globally circulation and precipitation patterns could be affected by subtle shifts in heating. But the precise impact would require more modelling to really predict.
Why are tropical savanna dry summer (As) climates a lot more common than Aw (tropical dry winter) climates? Is it the way ExoPlaSim interprets summer and winter?
ReplyDeleteHonestly not sure; ExoPlaSim has no internal definition of "summer" and "winter", the koppenpasta script decides them based on which 6-month stretch of the year (or whatever half the year is for a particular case) has the highest average temperature. In general exoplasim seems to have a bias towards wet-winter climate compared to Earth, so there's probably some underlying issue somewhere in how it handles the water cycle, but it's hard to pin down exactly what (I should maybe poke around in the results some more and try to see if it's making winters wetter or summers drier). Also worth noting that sources are a bit inconsistent on what exactly defines As climates, I've gone with a simple definition just based on whether summer or winter overall have more precipitation, but some other sources imply it should use the same definition as for Cs and Ds climates, which is based on seasonal extremes and would probably make them rarer.
DeleteHow could I maximise As (tropical savanna dry summer) climates in both the ITCZ influenced areas (through rain shadows) and the mid latitude areas (where mediterranean climates would usually be) on a hotter habitable planet without making them too dry (due to desert belts moving poleward)?
ReplyDelete