Climate Explorations: Day Length
 |
| "True color" approximation for Earth with 30x longer days. |
The rotational period has two notable effects on the climate: For one, it controls the length of the day, and longer days allow for both more heating during daylight and more cooling at night, creating greater extremes of temperature each day without necessarily altering the overall average temperature. ExoPlaSim doesn’t directly report the day- and nighttime temperatures, but the maximum and minimum temperature outputs can give us some sense of how much the temperature varies in each month, mostly as a result of the day/night temperature swings. As a point of reference, here’s how these values look for our baseline model:
 |
| Note that the max and min temp are sampled from the surface temperature, not the 2-meter air temperature I show for the averages; they’re typically within a few degrees of each other, but that’s why you can see areas of the polar oceans where sea ice keeps the max surface temp below freezing, but the average air temp is a bit warmer. |
The influence of water’s high thermal inertia is clear: open ocean experiences basically not daily temperature variation, rainforests only vary by around 5 °C, other vegetated areas by 10–15 °C on average, and arid regions around 20 °C (in addition to the effect of surface water, cloud cover over wetter regions also slows warming by day through their high albedo and cooling at night through a local greenhouse effect). There’s also a surprising amount of variability at the poles, especially in winter, when sea ice insulates the surface from the ocean and the cold air carries little moisture; but this is due not to the day/night cycle but oscillations in the polar front that carry alternating cool and warm air masses across vast areas in a roughly week-long cycle.
 |
| Air temperature variations in the middle atmosphere due to movement of the Polar front in late January. |
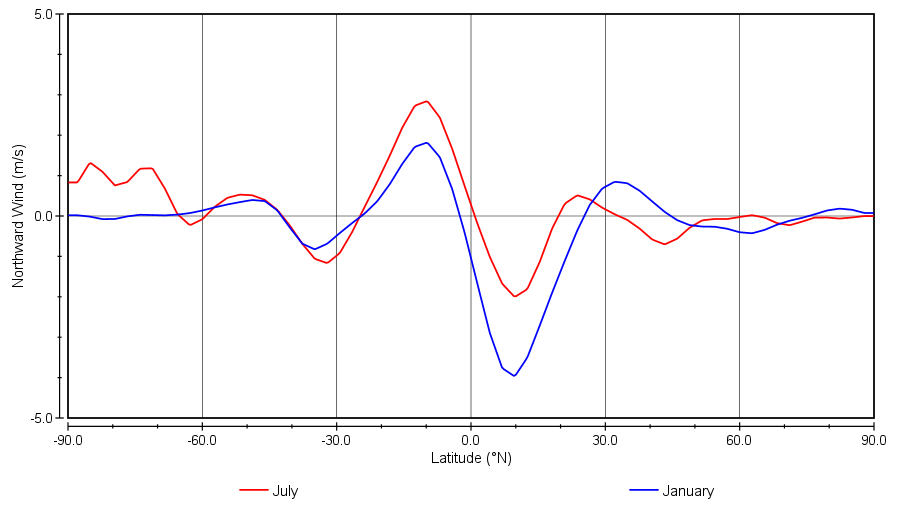
In reality of course, air particles do not instantly teleport around but still, as air moves north or south, it tends to retain its initial velocity while passing over ground of gradually changing speed; from the perspective of the ground, this makes it appear as if the air is constantly accelerating towards the east if it moves towards the poles and towards the west if it moves towards the equator, and thus its path over the surface curves in these directions.
 |
| Rotational speed of Earth's surface and tendency of poleward or equatorward winds to curve in each hemisphere. Paul Webb |
Thus, air cannot directly circulate between the warm equator and cool poles as it otherwise would; it is instead deflected by the Coriolis effect until it is moving directly east or west, forming a jet stream, and then eventually is slowed enough by friction with the surrounding air to become static with the ground, by which point it has generally warmed or cooled to the ambient temperature and so is pulled by convection currents back to where it started.
 |
| Typical cross-section through Earth's atmosphere along a line of latitude (greatly vertically exagerrated). NOAA |
On Earth, the Coriolis effect limits air to moving about 30° north or south before being deflected into a jet stream, creating 3 circulation cells in each hemisphere:
- In the Hadley Cell, warm air rises at the equator, travels polewards at high altitude to the subtropical jet at 30°, cools and sinks, then returns back equatorwards at low altitude.
- In the Polar Cell, cool air falls at the poles, travels equatorwards at low altitude to the polar jet at 60°, warms and rises, and then returns back polewards at high altitude.
- And the Ferrel Cell bridges the gap; the low-altitude high-pressure zone created by falling air at 30° pushes some air polewards at low altitude, and this is pulled in by the low-altitude low-pressure zone created by rising air at 60°; at high altitude, high pressure at 60° then pushes it equatorwards and low pressure at 30° pulls it in.
The low-altitude parts of these circulation cells (where air is of course being deflected into curved paths by the Coriolis effect as well as moving polewards or equatorwards) create the prevailing winds that we experience on the surface, bringing water from the seas onto the continents in some areas while leaving others downwind of moisture-blocking mountains and upwind of seas dry. In addition, the upward convection at the equator and 60° creates the rainy and stormy ITCZ and polar front, respectively (upward motion causes air to cool and water vapor to condense), while the downwind convection at 30° suppresses precipitation and thus creates the dry horse latitudes.
 |
| Burschik, Wikimedia |
This also impacts the general character of weather at different latitudes; the Hadley and Polar cells are directly convection-driven and so tend to have fairly strong and consistent winds, while the Ferrel cell at mid-latitudes is more indirectly driven and so has more irregular weather patterns and variable winds.
If Earth rotated faster, the Coriolis effect would be stronger, and thus air couldn’t move as far before being deflected into jet streams; thus, circulation cells would be thinner and more Ferrel-like intermediate cells may be required to cover the full distance between equator and poles. Additionally, more circulation cells with less direct motion of air hinders transport of heat across latitudes, keeping the equator warmer and cooling the poles. With slower rotation, the reverse; broader and fewer circulation cells, and more efficient heat transport towards the poles. In either case the prevailing winds and boundary zones will shift, and the climate zones with them.
Bear in mind though that convection cells are not static objects; the boundaries shift with the seasons as the warmest part of the surface shifts, in some cases creating the alternating patterns of wet and dry that define certain climate zones. It is even possible for whole cells to appear and disappear across seasons, as we saw when investigating obliquity. And really this is just an overall tendency of global circulation; local interactions of oceans, continents, and mountains regularly create circumstances where local prevailing winds move in reverse to the overall direction of the circulation cell over that region (moreso in the weaker Ferrel cell).
We can track these circulation cells and their effects a few different ways; first, the maps of near-surface winds I’ve been showing so far, though for the above-mentioned reasons (and limited resolution of the climate model) the cells and boundaries can sometimes be hard to pick out:
 |
| Note that because of the finer-scaled circulation patterns we’ll be seeing here, I’ll using closer-spaced wind arrows and full-resolution seasonal maps in this post. |


First, by default ExoPlaSim treats sidereal days (time for a planet to rotate once on its axis) and synodic days (time for the sun to complete one circuit in the sky) as equivalent. In truth, for a prograde-orbiting planet, the synodic day should be longer (because the planet moves in its orbit over the course of the day such that it needs to complete more than a full rotation for any point of the surface to aim directly towards the sun again). With long years and short days, it doesn’t make much difference; on Earth, it's a difference of less than 4 minutes. It matters more when year and day length are more similar: make the rotation period half the length of the year (a 2:1 spin-orbit resonance), and there should be one synodic day per year, but ExoPlaSim will show two—one each rotation period.
With the newest ExoPlaSim (as of May 2023), there is now an option (set by the “keplerian” parameter) to use more robust orbital code which, among other advantages, does properly computer synodic days from rotation period and year length. I didn't use it for any of the models here, but it’s not a big issue; the difference in Coriolis forces between a 30-day rotation period and the 27.7-day period that would actually be required for 30x longer days is pretty slight.
Second, as per usual I tried to run these models in sequence, restarting each from the last where appropriate, but it seemed that reducing rotation period across a restart caused the model to promptly crash while increasing it did not, so all the shorter-day models were started from scratch.
Finally, I have yet to find an exact explanation for how the maximum and minimum temperature outputs in ExoPlaSim, but based on some experiments and a bit of digging in the code, my best guess is that they’re sampled out of ~5-day periods, depending on the timestep. You may recall that, to save on memory, ExoPlaSim gathers up data at regular intervals set by the “NSTPW” parameter—about every 5 days (120 hours) by default—and then, at the end of each year, averages the data from these intervals together into months. It seems that at the ~5-day intervals, the maximum and minimum temperatures over that period are found for the corresponding data parameters, but then these parameters are simply averaged together across intervals to produce the monthly outputs. For Earth-like and shorter days, this isn’t much of an issue; if anything it makes them a more reliable indicator of typical day and night temperature. But for longer days, it may understate the actual temperature swings. Thus, for the 5x, 10x, and 30x day runs, I did an extra 3-year run with NSTPW set to always be equivalent to 120 hours and output the results with 120-hour months, then collated that data myself into a single average with proper max and min temp for each month for making the maps with max temp, min temp, and temperature range.
Previous Exploration: ObliquityShorter Days
To reiterate, shorter days with faster rotation cause stronger Coriolis forces, creating thinner and more circulation cells.
1/2 (12 hours)

Prior Model: None
CO2 Level: 300 ppm
Average Temperature: 15.2 °C
Halving the day length has a subtle effect overall, with basically the same global average temperature, but we can see some notable shifts in the details.


The more complex atmospheric circulation has also cooled the poles, extending tundra and subarctic climates into central Europe (in reality warm ocean currents—which aren’t fully modelled in ExoPlaSim—may temper that to some extent, though I’m not sure exactly how they’d be affected by the faster rotation and shift in atmospheric circulation, they could conceivably shift enough to cool Europe instead). As to daily temperature variation, aside from changes due to shifts in biomes (larger tropical deserts, more sea ice coverage), daily temperature variation appears to be a few degrees lower on average, with even arid regions tending not to swing by more than 15 °C.
1/4 (6 hours)


Prior Model: None
CO2 Level: 218 ppm
Average Temperature: 15.8 °C
On this world, you could go to bed in the evening, sleep through the entire next day and night, and wake up the subsequent morning without having to oversleep.

As expected, the Hadley cells have shrunk further, now reaching to only about 20° latitude. The Ferrel cells have moved in as well, but not nearly as much as I had previously predicted based on an idealized model with no land or seasonal shift in temperatures.

Past that, I can pick out perhaps 4 more reversals in wind direction in the southern hemisphere in winter. Surface winds are weaker overall, averaging about 60% the speed as in the baseline model.

Looking at the vertical air velocity indicates perhaps 8 or 9 circulation cells on average, some only spanning a few degrees of latitude.

Though the ITCZ receives less moisture from the smaller Hadley cells, it also moves less, ensuring consistent rains to the thin surviving equatorial rainforest belt. The deserts have shrunk overall from the previous model, likely due to the encroachment of the rain belt at the poleward ends of the Ferrel cells. The circulation cells are too small and weak to create large desert belts, but do manage a couple semiarid patches in central Asia and western North America.

Further weakened heat transfer to the poles has warmed the lower latitudes, expanding the tropical and temperate climates, while the ice caps and cold-winter subarctic climates have expanded as well, pinching out the humid continental regions. Despite the increased ice cover, the planet is warmer overall. My best guess is that this is due to reduced cloud cover over the tropics because of the reduced Hadley cells, lowering the planet’s overall albedo. Indeed, the planet is absorbing about 1.7 W/m2 more sunlight than baseline, enough for a bit over a degree of heating.

And, of course, short-term temperature variation has decreased, remaining below 10 °C even in many arid regions.
1/8 (3 hours)


Prior Model: None
CO2 Level: 6400 ppm
Average Temperature: 15.5 °C
This is approaching the limit of how fast an Earthlike planet can spin without tearing itself apart. Watching the extended editions of the Lord of the Rings trilogy would take almost 4 days on this planet.
One important note here is that, at such fast rotation, the centrifugal forces would cause the planet to significantly deform; the equator would bulge out to about 107% of Earth’s current radius, while the polar radius would shrink to about 86%. This bulging and the centrifugal force counteracting gravity would lower the effective gravity at the equator to about 64% of its current value, while it would rise to 106% at the poles. This is probably going to have some impact on atmospheric circulation and climate, but ExoPlaSim isn’t really equipped to handle variation in planet radius or surface gravity across the surface, so I couldn’t really guess what it would be; just treat the results here with some caution.
What we see overall is an odd reversal of trends in some ways; the shrinking tropical rainforests have suddenly expanded and overtaken much of the former subtropical deserts, and much-increased CO2 has been required to keep the world from cooling.

The Hadley cells still extend to around 20° latitude
but past that I won’t try an exact count of how many additional circulation
cells they are; the vertical air velocity seems to indicate it's in the 8-12 range, but it varies by season, though a few wind
bands in the southern ocean appear to be particularly consistent.


Though winds over the poles don’t appear quite as consistent, there is a notable banding in the cloud cover there as clouds circle in regular paths; cloud cover at any one point in time will be more patchier, but from space you still might see something like a bullseye pattern over the poles in winter.
 |
| Average cloud cover across January and July (top) and a snapshot of cloud cover over the south pole in July (bottom). |
Immobile though some of these convection cells are, they’re also so thin that there’s little space between them for dry desert belts; in many places the edges of the summer position of the ITCZ’s rain belt overlaps with the winter position of the rain belt at the poleward end of the Ferrel cell, leaving no rainless gap in between.

The result is thus a patchwork of moderately wetter and drier regions over much of the tropics. There is a notable dry patch over central and west Asia—and to a lesser extent in west North America and west Australia—where the high-pressure zone created by the warm continent in summer overwhelms the weak circulation cells.

And, of course, heat transfer to the poles is even weaker than our previous models. The tropical climates have further expanded, and much of them never drop below 30 °C. Substantial temperate regions exist, but there's a stark drop in temperature towards the ice sheets, and, in some places, as little as 10° latitude separates tropical seas from permanent ice sheets (one wonders what could be achieved were fast rotation combined with low obliquity). Winter temperatures at the poles can drop to below -120 °C.
 |
| Average temperatures by latitude for each of the models with faster rotation. |
The overall cooling of the planet (requiring the CO2 increase) can probably be attributed to both increased and more persistent ice cover and more tropical cloud cover as the Ferrel cells have shifted equatorwards. And lastly, with more evenly distributed moisture and such short days, short-term temperature variation is less than 5 °C across most of the continents.

Where the climate is reasonably warm, this is a very lush world; even many semiarid regions are thickly forested, and much of southern and northern Africa is more productive on average than anywhere on Earth today.
Longer Days
To reiterate, longer days with faster rotation cause weaker Coriolis forces, creating broader and fewer circulation cells.
2 (48 hours)


Prior Model: Baseline
CO2 Level: 338 ppm
Average Temperature: 14.3 °C
As you might expect, the trends here are largely the reverse of what we saw with the shorter days.

The Hadley cells have expanded, reaching to about 45° latitude, and the Ferrel cells have shifted poleward in turn—to the point that the northern polar cell seems to have disappeared entirely. There’s also a bit more swing between seasons in the circulation cell boundaries, at least in the northern hemisphere.

For these models with larger circulation cells and stronger winds, I’ll switch back to more widely-spaced wind arrows.

The desert belts have accordingly shifted poleward, with the broad ITCZ rain belt feeding broad tropical and monsoon rainforests on the equatorward side and Mediterranean and similar dry-summer continental climates dominating Europe and central Asia on the poleward side.

Before CO2 adjustment, the slower rotation caused about a 2 °C drop in global average temperature; as you might guess based on what we saw with 6-hour days, I think this is caused by the greater tropical cloud cover due to the wider Hadley cells pulling in more moisture. Despite the more direct equator–pole circulation, the overall temperature profile is not much different from baseline, perhaps because the global cooling has allowed more ice cover at the poles.

The longer days have had a clearer effect on the daily temperature variation (though broader dry-summer conditions help as well); it remains moderate in the broad rainforests, but in other areas now regularly reaches 15-20 °C.
5 (120 hours)


Prior Model: 2x day
CO2 Level: 510 ppm
Average Temperature: 14.3 °C
This is now a more substantially different climate, with climates not just shifted but in some ways rearranged.

The Hadley cells now absolutely dominate global circulation, reaching to about 60° latitude, though it’s hard to say where they end exactly; rather than winds at the horse latitudes neatly diverging to equator- and westward Hadley cell winds and pole- and eastward Ferrel cell winds, there are instead two belts at 60° latitude (the northern one only clearly appearing in winter) of winds blowing almost directly east, in some cases exceeding 70 km/hour on average, which then curve at the edges into each circulation cell, transitioning to more typical tropical trade winds at around 30°. This is perhaps related to a larger subtropical jet stream more directly influencing surface winds.

Despite this wind pattern bringing strong onshore winds to Europe, south Australia, and west North America, downward convection prevents much rain (with a finer-resolution model we might expect to see some more patches of orographic rain on the upwind side of mountains) and desert belts extend across much of the high latitudes, leaving only a thin strip of subarctic climates that still receive fairly little rain but are cool enough to remain moist regardless. Meanwhile, the ITCZ swings to as far as 30° latitude in summer and brings a broad rain belt with it.

The shift in circulation—and to some extent the further increased cloud cover over the tropics, necessitating more greenhouse heating—has flattened out the temperature profile somewhat, with few areas averaging above 30 °C and expanded highland temperate climates but warmer mid-latitudes. The poles, however, are even colder than in the baseline or 48-hour models, insulated behind the eastward wind belts.

The combination of these factors has effectively swapped the temperate and arid climate bands; though the temperate band is generally warmer than its Earth counterpart, and in many cases has a monsoonal rain pattern, and the arid band cooler. For inhabitants of this world, it may be the norm to think of seasons mainly in terms of shifts in precipitation, with large seasonal shifts in temperature and winter snowfall being features of the barren polar deserts.
But these are just average temperatures: between the long days and nights, even rainforests see temperature shifts of at least 10 °C, and in the deserts it reaches over 25 °C. Thus, much of the seemingly cool deserts reach over 40 °C by day in summer while still cooling enough in winter for overnight frosts, and many tropical regions regularly drop below 15 °C at night.
10 (240 hours)


Prior Model: 5x day
CO2 Level: 791 ppm
Average Temperature: 14.4 °C
If you want as much temperate climate as possible, I suppose this would do it.

The Hadley cells near-totally encompass the planet, though some hint of the Ferrel cells remains at the poles, especially in the south, and the band of eastward winds remains, essentially forming a vortex over each pole.


Between these, powerful winds blow almost directly towards the ITCZ. This creates not so much a thin tropical rain belt as a thick band of rain encompassing the tropics.

With the near-disappearance of circulation cell boundaries inhibiting heat flow, the temperature profile across latitudes has substantially flattened out, and the equator now only averages about 40 °C hotter than the poles. On the one hand, this has eliminated the ice caps and most tundra, but on the other, most tropical climates have disappeared as well; even near the equator, average temperatures often drop below 15 °C on cool months.

But, of course, short-term temperature variation has further increased; despite shifting poleward, the much of the deserts still reach 40 °C by day in summer, and nighttime frosts in winter are now the norm even on much of the equatorial continents.

Where once the Sahara Desert stood is now a thick temperate forest with light winter snowfall.
30 (720 hours)


Prior Model: 10x day
CO2 Level: 2609 ppm
Average Temperature: 14.2 °C
Each day now lasts a full month; near the equator or at equinox, 15 days of light and 15 days of darkness. Over the course of one of our days, you’d only see the sun move through the sky by 12°.

The climate of this world is in something of a transitional state between what we see for rapid rotators, where global circulation patterns are determined by the interplay of the pole–equator temperature gradient and Coriolis forces, and so organized into circulation cells occupying different latitudinal belts with globe-circling lines of convergence or divergence between them, and the climate of slow rotators, where the day–night temperature gradient dominates and so circulation patterns follow the motion of the substellar point (SSP), the point on the surface facing directly facing the sun and so receiving the most heating.

To start, let’s look at monthly averages like usual. Some scrap of the Ferrel cells still stubbornly hold on and eastward winds still circle the poles, but these are far weaker than in our previous models. Over most of the planet, the prevailing winds trend almost directly equatorwards, but again these are averages; we’ll see more shorter-term variation shortly. I had previously predicted based on simpler models that we should see some atmospheric superrotation near the equator for such slow-spinning planets, but I see no sign of that here; perhaps it requires a greater latitudinal temperature gradient or less seasonal shift in circulation.

The ITCZ reaches to over 30° latitude in some spots in summer, but its exact position almost doesn’t matter, so broad is the rain belt around it. With the near-disappearance of the Ferrel cells, the band of subarctic climates in the previous models has been reduced to a few small patches; so far as the people of this world are concerned, everything past 50° latitude is dry, barren desert.

And as mentioned, the global temperature profile has continued to flatten; the poles average around 0 °C and the equator under 20 °C. 10-15 °C averages are the rule across the habitable temperate belt, with the seas remaining notably warmer on average and the polar deserts seeing more seasonal warming and cooling. Daily temperature variation, on the other hand, has continued to increase, surpassing 30 °C on much of the continents. Days are often a balmy 20-30 °C, while nights almost always drop below freezing at least briefly; Africa now receives as much snowfall on average as Antarctica, though neither sees particularly much.

Thus, unlike in any of our previous models, the temperature contrast between day and night (at least over land) exceeds the average contrast between equator and poles and is at least comparable to that between summer and winter hemispheres. This leads to significant variation in wind and precipitation patterns within each month. Showing this variation across the day for the whole globe over different seasons would be a bit much information to fit in here, so I’ve instead I’ve picked out the specific example of North America across one day extending from late June to late July in 5-day averages (from the same data I used for the maximum and minimum temperatures).
 |
| Left to right: relative solar irradiance (red highest, blue lowest), 2-meter air temperature, surface winds, and precipitation (the latter 3 all on the same scales as the other maps in this post). |

Throughout morning the continent warms and soon much of the east surpasses the temperature of the nearby oceans. The winds shift, blowing more across the continent than out from it and so bringing in some moisture from the Arctic, and some upward convection allows rainfall to begin in the interior.


As the SSP passes over the continent through midday, stiff winds converge on its center and heavy rains cover much of the interior. But the coasts remain oddly drier than either the interior or the oceans; it’s hard to pin down the exact reason for this, but I suspect it’s because coastal waters are kept cool by the lower average temperature of the continents but don’t warm with it by day, causing air to locally sink and diverge.

The continent remains warm well after the SSP passes over, and so the convergent winds and rains continue, shifting gradually west, and coasts get somewhat wetter as the coastal waters reach their warmest.

By midnight, the continent has cooled past the temperature of the oceans again, and so wind direction reverses and the rains cease.
A similar pattern occurs in winter as well, but with weaker convergence of winds as they instead blow predominantly towards the warmer summer hemisphere, so rains are even more restricted to the interior.
 |
| The same data as above for midday in late January. |
This causes the curious pattern of dry coasts and wet interiors you can see on the climate zone map. It also reveals a regular pattern of wet days and dry nights; the rain is accompanied by thick cloud cover, much like at the SSP of a tidal-locked world, so, though the continent generally warms through the day, the most direct sunlight may actually often come in morning before the rains begin.
The long, dry nights don’t seem to bother vegetation much (or at least ExoPlaSim’s simplistic representation); thick forest extends practically without interruption between the polar desert belts.

That’s where I’ll leave it today. Days longer than a month are problematic to interpret through the Koppen system, because they induce warming and cooling cycles long enough to affect monthly averages but not associated with the seasonal cycle. I still want to explore some cases with very long days, approaching the length of a year, but that will likely require some in-depth investigation of the data to understand (and wrangling with ExoPlaSim’s sometimes unreliable timekeeping to run properly), so I’ll leave it for another day. In the meantime, the recent ExoPlaSim update means I can finally get around to modelling climates with high eccentricity, so expect to see those in the future
Notes
I recently discovered that if I strip out a lot of the more esoteric atmosphere data, I can trim down the ExoPlaSim outputs to about 3-4 Mb, which is small enough that I can start putting them online in this repository. The outputs from the previous two climate explorations are already in there, and I’ll add those from this post soon—as I will for all future climate exploration posts.
I didn’t do any runs in ExoPlaSim for retrograde rotation because it doesn’t really change the overall character of the climate in a manner independent of the specific topography of Earth (you’d get the same result if you just flipped the topography map horizontally). But, at the urging of a patron, I did pull the data published with this paper, using a higher-end climate model, and run it through my koppenpasta script. Here are the results (in the model resolution and interpolated, both cut to Earth’s coastlines because I was too lazy to track down the model land/sea data); check out the paper if you want to know any more about the details of this climate.


Is it possible to use ExoPlaSim to simulate climates for different planetary radii as well? I'm thinking specifically of super-earths up to 2x radii, with gravity ranging from almost normal to fairly intense, but it would also be interesting to see results for smaller Luna or Mars sized planets. I'm not sure if ExoPlaSim has that capability, but I thought I'd ask!
ReplyDeleteYes, it takes radius and surface gravity as input parameters (you just can't have gravity that varies between different parts of the surface), and it's on the list for a future exploration post
DeleteSomething you may want to play with as well, if you're doing both radius and (by extension) gravity: planetary density. Give Earth a density like that of iridium (sure, you'd need to add a crust, but there'd be compression as well, and planets here don't necessarily have to be natural) and you'd get a world with Earthlike surface gravity but a Moonlike diameter; do the same for lithium and you'd get a planet with Earth's surface gravity but about twice the radius.
DeleteAlso, since Earth isn't a perfect sphere, then wouldn't either speeding up or slowing down Earth's rotation move the oceans? If so, is ExoPlaSim capable of modeling this and then extrapolating the climate? Because that sounds as interesting as the rest of this.
The plan is to stick with densities appropriate to planets with earth's composition. Natural habitable planets are unlikely to deviate much from that and given how many runs I have to get to I'm not yet going to spend time on anything purely fantastical.
DeletePresuming you're not promptly shifting the rotation rate and instead everything has had time to reach equilibrium, the distortion caused by rotation would apply equally to the crust and oceans (so sea floor and ocean surface would bulge out the same amount, and thus you'd end up with the same ocean depth). As mentioned for the 1/8 day case, rotation that fast would cause significant variation in surface gravity across the surface, but exoplasim has no way to model that.
Sorry, accidentally entered my comment as a reply to the other commenter.
ReplyDeleteGood post! I was thinking about the longer days in light of habitable moons, since you could potentially get some large moons on what are basically very long days as they rotate around their planets (a Moon with Callisto's orbit would have a day nearly 17 times Earth's). Although with those, you'd also add in temperature change from the increase/decrease in solar insolation as the moon orbits around its parent planet.
The "30x" one is wild. Essentially mini-seasons over most of the continental interiors between the polar deserts, which makes me wonder if plants on such a world would tend to resemble conifers more than anything else: shallow-rooted plants with waxy thin needles designed to resist water loss and allow for them to quickly warm up and grow. It'd be risky to be a deciduous plant, since your leaves wouldn't have much time to grow.
Does the model take into account that having thick forests over the tropical and temperate regions would lower albedo there, causing overall warming?
You would generally expect the change in insolation over a moon's orbit to be negligible; Callisto experiences less change in distance from the sun over its orbit than the Earth does due to its slight eccentricity.
DeleteIt's a fair point about plant types, the nightly freeze would be a problem for deciduous leaves, but the long, warm days in the tropics may still encourage faster growth and more competition for light than we see in Earth's pine forests.
The model does account for how vegetation and soil moisture affect albedo and evapotranspiration. It seems that the increased cloud cover just has the bigger overall effect (I should maybe have also mentioned that with the 30x day case you might start to see a cloud formation that follows the SSP, further enhancing its cooling effect).
Thanks for the reply!
DeleteYou had to ramp up the CO2 on the "30x" scenario to keep it close to Earth-level average temperature. If CO2 levels crashed down to more parallel Earth levels, do you think that would show up mostly as colder nights, colder days, or both? The polar regions seem dry enough that you still might not have any ice sheets forming over most of it, although you'd presumably have some large mountain glaciers between the poles.
Probably fairly uniform cooling across the day but perhaps nights might be a tad more impacted. The dryness of the poles may delay the formation of glaciers but I don't think it's going to prevent them entirely, you just need a bit more ice accumulation than loss and on a world with such a flat average temperature profile the ice-albedo feedback could be quite strong.
DeleteGreat post as always!
ReplyDeleteDo you have any intention of doing an exploration on the effect of longer _years_ (i.e. adjusting the orbital period of Earth/parameters of the sun while holding constant the amount of sunlight reaching the surface)?
After the next set of models on varying eccentricity, my intention is to indeed do a set of runs at different orbital distances, but exoplasim has a known bug with underestimating the greenhouse effect of more than 0.1 bar of CO2 which may make it difficult to really explore the outer habitable zone. But after that I'll also be exploring planets in the habitable zones of other stars, which will also involved adjusting year length
DeleteOr, make the star brighter instead of adjusting CO2
DeleteNice work out there. You do a great job at explaining ExoPlaSim scenarios. Speaking of them, they all make good settings for literary works.
ReplyDeleteHello, regarding ExoPlaSim, can the program simulate the effects of greenhouse gases, particularly CO2? From a paleontological point of view, I think this might be important.
ReplyDeleteIt's one of the central features, though it has limits; CO2 can be specified and this is the main way I control temperature in these models, but it becomes inaccurate above around 0.1 bar of CO2; the water cycle and its greenhouse effects are all determined internally in the model; and ozone can be added but it's a bit simplistic and doesn't account for different levels of oxygen or UV radiation.
DeleteBut for paleoclimates better models have already been run; a little while back I pulled some data from one and made these maps for the last 550 million years; I'll make a little post about them here sooner or later https://drive.google.com/drive/folders/1jIxCr6gFuKBtOuzpXC7sTGSA19LHFVdS
Thank you, World Building Pasta! Did you run all of those simulations on your own?
DeleteWhere did you get all of those paleomaps from? Does map take into consideration the relief of the world at different times?
By the way, i know this is just a simulation, but the place where Morrison Formation should be seems more arid than expected.
Although i can't tell how biomes on a world with almost no land plants work, this seems great.
I actually ended up writing up a short post on these that I'll put out next week, but in short: I did not run these, just pulled the data from a paper and ran it through my script for climate zones. Geological reconstructions of past topography were used, but these are fairly coarse and imprecise. Jurassic Morrison is generally interpreted as a semiarid environment with strongly seasonal precipitation, with much of the fossils likely coming from riverbeds where occasional flooding might have helped burial. Koppen-Geiger climate zones are based only on precipitation and temperature, there not really "biomes" in the strictest sense though they are intended to correlate to biomes.
Delete“Walking with Dinosaurs” showed animals from the Morrison Formation living in the Jurassic equivalent of grasslands (seed ferns instead of grass). So they probably were not that far off 25 years ago.
DeleteThey didn't have a lot of freedom in good filming locations for the show so they weren't necessarily exact matches, and at any rate the formation covers a large range of space and time, so it did vary.
DeleteI can understand those limitations. They made an effort not to show any grass in this TV series. (Grass is now known to have existed in the mid to late Cretaceous but was not common.) I have noticed the Köppen classification does not exactly match the biomes. So it could have been slightly greener then the map suggests. I know one Diplodocus skeleton was found in a rock layer formed by a seasonally dry lake. This should indicate a fairly dry climate. Still, I don’t think an ecosystem dryer than a steppe could have supported a viable population of such large animals. Diplodocus was at least the size of the largest species of mammoth seen by humanity.
DeleteAgain, the Morrison formation represents a large area over a large range of time, so doesn't represent a single uniform climate. There are probably papers around about its paleoclimate that might be a bit more informative than a 25-year-old tv show
DeleteI was thinking in terms of accuracy compared to of what is known today. Once upon a time I downloaded image showing their reconstruction of Liopleurodon. I have now got rid of this file since it was based on a huge overestimate of the animal’s size. An animal 1/4 of its length and 1% of its weight would have a quite different build.
DeleteI have really enjoyed this part of the series! I'm currently working on an Earth-sized world with a 3:2 resonance, with an orbit similar to Mercury. Had a nightmare time trying to figure out the timesteps, runsteps, etc. in the script. I ended up inputting numbers that may not be correct for what I'm going for. But my world ended up a very hot, cloudless desert world (325 K) with subarctic climate zones , esp. at the south pole.
ReplyDeleteWill there be a more in-depth tutorial or guide to scripting these kinds of worlds? Many thanks!
Good analogs for the polar deserts would be the Gobi and perhaps the Taklamakan; both exhibit the same temperature range.
ReplyDeleteIn a world with 0 or 180° obliquity, 0 eccentricity (no seasonal forcings) and a solar day length of 128 days, how would the climates be? Would the day always be wet and the night dry?
ReplyDeleteSomething like that, I've only seen one or two studies with these sort of very long days for non-seasonal planets, it seems like you should develop something like a tidal-locked planet's circulation patterns, but following the progression of the sun (and lagging behind the substellar point a bit at any given time). This doesn't imply constant rain through all hours of daylight (mornings in particular may tend to still be dry) or none at all at night, but overall you expect wetter days and drier nights. Topography could complicate matters in all sorts of ways.
DeleteGood to know. Btw I’m the one who’s commissioning you for the climate of my world Patrula d. I’ve responded to your email.
DeleteWhat are the lines of latitude for a planet with 12 hour rotation rates ?
ReplyDeleteThe same as for any other planet? What do you mean?
DeleteOh I meant like the cells
DeleteFor example the earth has 30 60 and 90 degrees of latitude where the cells end
DeleteAs said in the post, I'd ballpark the Hadley and Ferrel cells as extending to 25 and 40 degrees, and then past that are maybe a few more cells but they're too subtle to really pin down to a clear latitude range.
DeleteSo like the polar cell is subdivided into 3 weaker cells so like how will that function ?
DeleteWhen you say
ReplyDelete“ With slower rotation, the reverse; broader and fewer circulation cells, and more efficient heat transport towards the poles”
with slow rotation combined with high obliquity, it means more efficient heat transportation from the [summer] pole, thus weakening the “hot vortex” that with high obliquity may completely eliminate such transportation at Earth-like rotation periods. As I have said before, combining slow rotation and high obliquity using ExoPlaSim (which should allow higher resolution than the data provided by the team of He, Merrelli, L’Ecuyer and Turnbull at https://doi.org/10.3847/1538-4357/ac6951) would be very interesting.
Probably a bit late to be asking questions, but what would a low obliquity world with a day length approaching 14 days potentially look like? How would a lack of seasons interact with the more efficient heat distribution?
ReplyDeleteSeasonality on the slow-rotating cases is already pretty modest, I'm inclined to think that maybe the wet equatorial belt might be a bit thinner and the polar deserts larger and drier, though of course they'd probably be at least a bit colder. Would really have to model it to say much for sure, though.
Delete